European vs Cambodian Family Households
COMPARE
European
Cambodian
Family Households
Family Households Comparison
Europeans
Cambodians
65.0%
FAMILY HOUSEHOLDS
96.8/ 100
METRIC RATING
111th/ 347
METRIC RANK
61.4%
FAMILY HOUSEHOLDS
0.0/ 100
METRIC RATING
329th/ 347
METRIC RANK
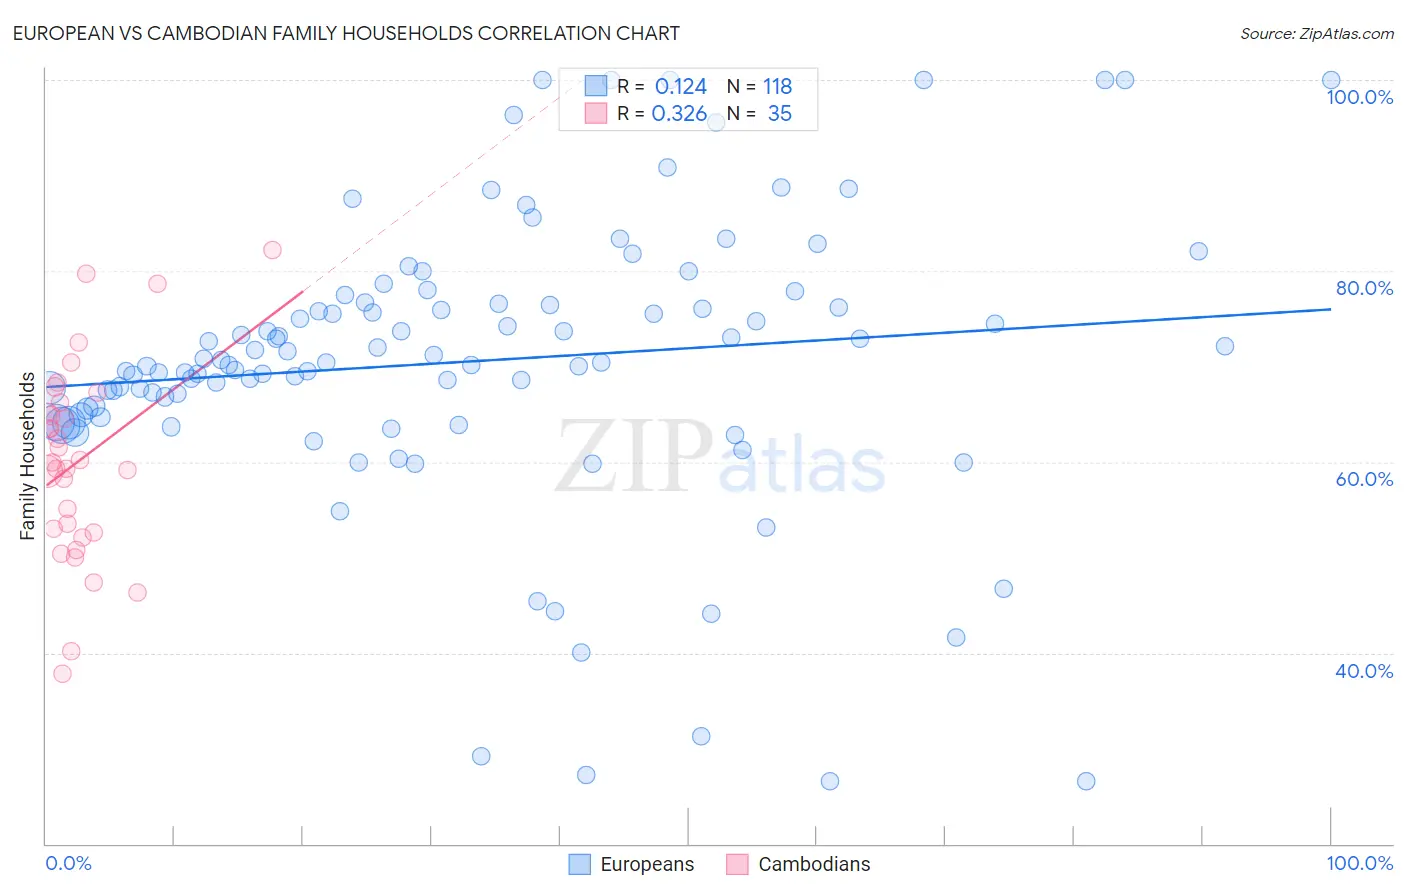
European vs Cambodian Family Households Correlation Chart
The statistical analysis conducted on geographies consisting of 561,245,057 people shows a poor positive correlation between the proportion of Europeans and percentage of family households in the United States with a correlation coefficient (R) of 0.124 and weighted average of 65.0%. Similarly, the statistical analysis conducted on geographies consisting of 102,469,130 people shows a mild positive correlation between the proportion of Cambodians and percentage of family households in the United States with a correlation coefficient (R) of 0.326 and weighted average of 61.4%, a difference of 6.0%.
Family Households Correlation Summary
| Measurement | European | Cambodian |
| Minimum | 26.5% | 37.8% |
| Maximum | 100.0% | 82.2% |
| Range | 73.5% | 44.4% |
| Mean | 70.5% | 60.1% |
| Median | 70.4% | 59.9% |
| Interquartile 25% (IQ1) | 65.0% | 52.6% |
| Interquartile 75% (IQ3) | 76.5% | 66.2% |
| Interquartile Range (IQR) | 11.6% | 13.6% |
| Standard Deviation (Sample) | 15.0% | 10.2% |
| Standard Deviation (Population) | 15.0% | 10.1% |
Similar Demographics by Family Households
Demographics Similar to Europeans by Family Households
In terms of family households, the demographic groups most similar to Europeans are Scandinavian (65.0%, a difference of 0.0%), Immigrants from Guatemala (65.0%, a difference of 0.010%), Immigrants from Jordan (65.0%, a difference of 0.030%), Palestinian (65.1%, a difference of 0.050%), and Alaska Native (65.1%, a difference of 0.060%).
| Demographics | Rating | Rank | Family Households |
| Spaniards | 97.8 /100 | #104 | Exceptional 65.1% |
| English | 97.4 /100 | #105 | Exceptional 65.1% |
| Whites/Caucasians | 97.3 /100 | #106 | Exceptional 65.1% |
| Alaska Natives | 97.3 /100 | #107 | Exceptional 65.1% |
| Palestinians | 97.2 /100 | #108 | Exceptional 65.1% |
| Immigrants | Guatemala | 96.9 /100 | #109 | Exceptional 65.0% |
| Scandinavians | 96.8 /100 | #110 | Exceptional 65.0% |
| Europeans | 96.8 /100 | #111 | Exceptional 65.0% |
| Immigrants | Jordan | 96.5 /100 | #112 | Exceptional 65.0% |
| Spanish | 96.2 /100 | #113 | Exceptional 65.0% |
| Argentineans | 95.7 /100 | #114 | Exceptional 65.0% |
| Ecuadorians | 95.4 /100 | #115 | Exceptional 65.0% |
| Immigrants | Iraq | 95.4 /100 | #116 | Exceptional 65.0% |
| Cherokee | 95.3 /100 | #117 | Exceptional 65.0% |
| Dutch | 95.1 /100 | #118 | Exceptional 64.9% |
Demographics Similar to Cambodians by Family Households
In terms of family households, the demographic groups most similar to Cambodians are Kiowa (61.4%, a difference of 0.030%), Immigrants from Australia (61.3%, a difference of 0.14%), Immigrants from France (61.3%, a difference of 0.14%), Black/African American (61.5%, a difference of 0.15%), and Indonesian (61.5%, a difference of 0.18%).
| Demographics | Rating | Rank | Family Households |
| Immigrants | Serbia | 0.0 /100 | #322 | Tragic 61.6% |
| Tlingit-Haida | 0.0 /100 | #323 | Tragic 61.6% |
| Immigrants | West Indies | 0.0 /100 | #324 | Tragic 61.6% |
| Immigrants | Switzerland | 0.0 /100 | #325 | Tragic 61.6% |
| Indonesians | 0.0 /100 | #326 | Tragic 61.5% |
| Blacks/African Americans | 0.0 /100 | #327 | Tragic 61.5% |
| Kiowa | 0.0 /100 | #328 | Tragic 61.4% |
| Cambodians | 0.0 /100 | #329 | Tragic 61.4% |
| Immigrants | Australia | 0.0 /100 | #330 | Tragic 61.3% |
| Immigrants | France | 0.0 /100 | #331 | Tragic 61.3% |
| Ethiopians | 0.0 /100 | #332 | Tragic 61.2% |
| Immigrants | Ethiopia | 0.0 /100 | #333 | Tragic 61.2% |
| Immigrants | Eastern Africa | 0.0 /100 | #334 | Tragic 61.1% |
| Carpatho Rusyns | 0.0 /100 | #335 | Tragic 61.1% |
| German Russians | 0.0 /100 | #336 | Tragic 60.9% |