Black/African American vs Armenian Births to Unmarried Women
COMPARE
Black/African American
Armenian
Births to Unmarried Women
Births to Unmarried Women Comparison
Blacks/African Americans
Armenians
44.3%
BIRTHS TO UNMARRIED WOMEN
0.0/ 100
METRIC RATING
333rd/ 347
METRIC RANK
26.2%
BIRTHS TO UNMARRIED WOMEN
99.9/ 100
METRIC RATING
19th/ 347
METRIC RANK
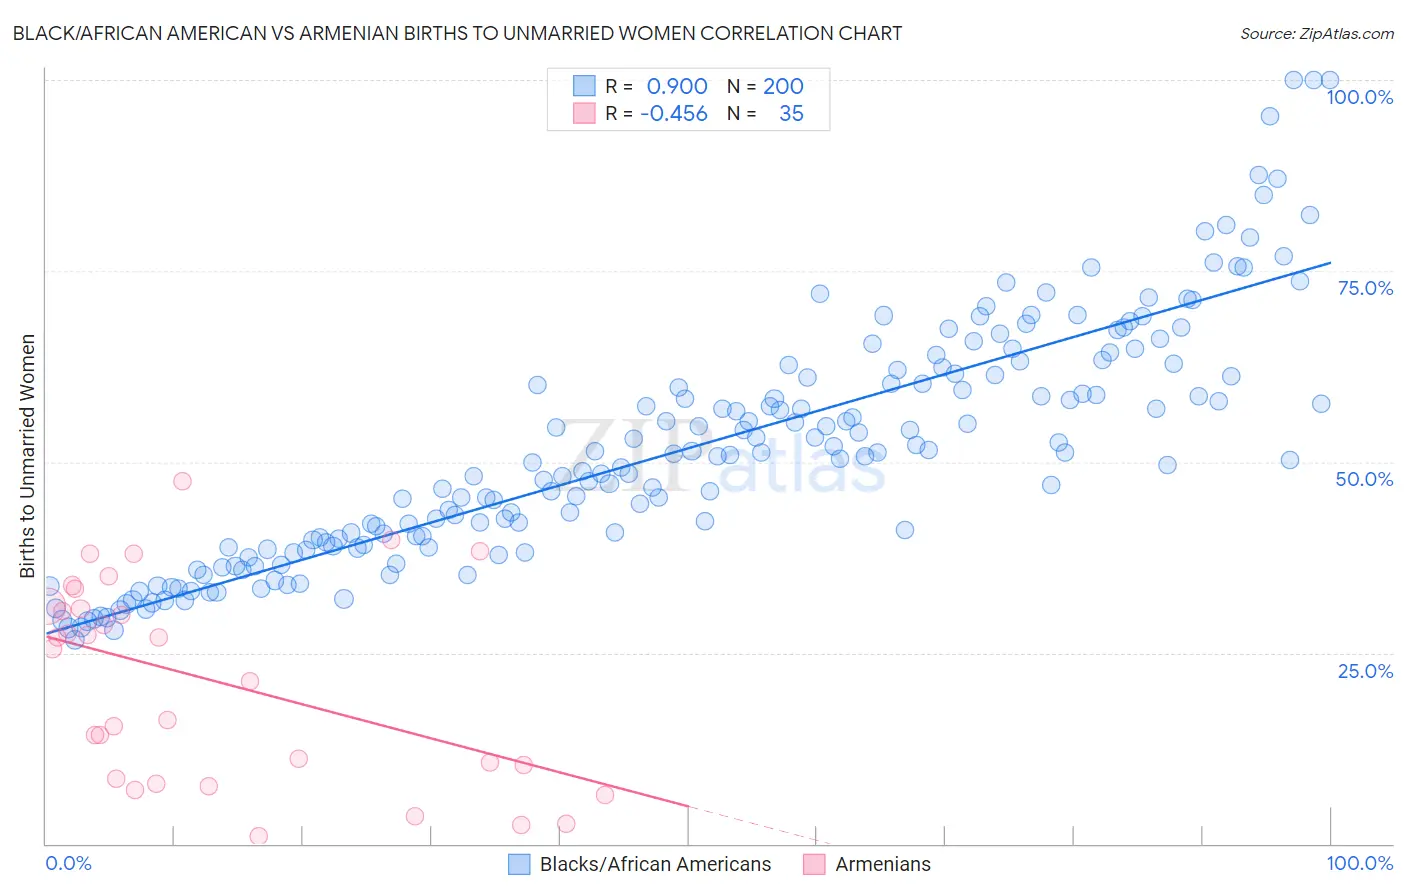
Black/African American vs Armenian Births to Unmarried Women Correlation Chart
The statistical analysis conducted on geographies consisting of 506,152,506 people shows a very strong positive correlation between the proportion of Blacks/African Americans and percentage of births to unmarried women in the United States with a correlation coefficient (R) of 0.900 and weighted average of 44.3%. Similarly, the statistical analysis conducted on geographies consisting of 289,699,675 people shows a moderate negative correlation between the proportion of Armenians and percentage of births to unmarried women in the United States with a correlation coefficient (R) of -0.456 and weighted average of 26.2%, a difference of 69.0%.
Births to Unmarried Women Correlation Summary
| Measurement | Black/African American | Armenian |
| Minimum | 26.7% | 1.0% |
| Maximum | 100.0% | 47.5% |
| Range | 73.3% | 46.5% |
| Mean | 51.8% | 21.4% |
| Median | 50.9% | 25.5% |
| Interquartile 25% (IQ1) | 39.1% | 8.5% |
| Interquartile 75% (IQ3) | 61.4% | 31.1% |
| Interquartile Range (IQR) | 22.4% | 22.6% |
| Standard Deviation (Sample) | 15.6% | 13.1% |
| Standard Deviation (Population) | 15.6% | 12.9% |
Similar Demographics by Births to Unmarried Women
Demographics Similar to Blacks/African Americans by Births to Unmarried Women
In terms of births to unmarried women, the demographic groups most similar to Blacks/African Americans are Yuman (44.4%, a difference of 0.17%), Colville (45.3%, a difference of 2.3%), Kiowa (43.1%, a difference of 2.7%), Native/Alaskan (43.0%, a difference of 3.0%), and Puerto Rican (45.7%, a difference of 3.1%).
| Demographics | Rating | Rank | Births to Unmarried Women |
| Immigrants | Cuba | 0.0 /100 | #326 | Tragic 41.5% |
| Tsimshian | 0.0 /100 | #327 | Tragic 42.2% |
| Immigrants | Cabo Verde | 0.0 /100 | #328 | Tragic 42.2% |
| Paiute | 0.0 /100 | #329 | Tragic 42.5% |
| Chippewa | 0.0 /100 | #330 | Tragic 42.6% |
| Natives/Alaskans | 0.0 /100 | #331 | Tragic 43.0% |
| Kiowa | 0.0 /100 | #332 | Tragic 43.1% |
| Blacks/African Americans | 0.0 /100 | #333 | Tragic 44.3% |
| Yuman | 0.0 /100 | #334 | Tragic 44.4% |
| Colville | 0.0 /100 | #335 | Tragic 45.3% |
| Puerto Ricans | 0.0 /100 | #336 | Tragic 45.7% |
| Houma | 0.0 /100 | #337 | Tragic 46.6% |
| Arapaho | 0.0 /100 | #338 | Tragic 47.1% |
| Lumbee | 0.0 /100 | #339 | Tragic 48.2% |
| Tohono O'odham | 0.0 /100 | #340 | Tragic 49.8% |
Demographics Similar to Armenians by Births to Unmarried Women
In terms of births to unmarried women, the demographic groups most similar to Armenians are Immigrants from Korea (26.3%, a difference of 0.21%), Soviet Union (26.3%, a difference of 0.35%), Burmese (26.4%, a difference of 0.57%), Immigrants from Armenia (26.1%, a difference of 0.58%), and Immigrants from Japan (26.4%, a difference of 0.76%).
| Demographics | Rating | Rank | Births to Unmarried Women |
| Indians (Asian) | 100.0 /100 | #12 | Exceptional 25.3% |
| Iranians | 100.0 /100 | #13 | Exceptional 25.3% |
| Immigrants | Lebanon | 100.0 /100 | #14 | Exceptional 25.3% |
| Immigrants | Singapore | 100.0 /100 | #15 | Exceptional 25.6% |
| Immigrants | Belarus | 100.0 /100 | #16 | Exceptional 25.6% |
| Immigrants | Uzbekistan | 100.0 /100 | #17 | Exceptional 25.8% |
| Immigrants | Armenia | 99.9 /100 | #18 | Exceptional 26.1% |
| Armenians | 99.9 /100 | #19 | Exceptional 26.2% |
| Immigrants | Korea | 99.9 /100 | #20 | Exceptional 26.3% |
| Soviet Union | 99.9 /100 | #21 | Exceptional 26.3% |
| Burmese | 99.9 /100 | #22 | Exceptional 26.4% |
| Immigrants | Japan | 99.9 /100 | #23 | Exceptional 26.4% |
| Immigrants | Australia | 99.9 /100 | #24 | Exceptional 26.6% |
| Cambodians | 99.9 /100 | #25 | Exceptional 26.7% |
| Asians | 99.9 /100 | #26 | Exceptional 26.8% |