Black/African American vs Belizean Births to Unmarried Women
COMPARE
Black/African American
Belizean
Births to Unmarried Women
Births to Unmarried Women Comparison
Blacks/African Americans
Belizeans
44.3%
BIRTHS TO UNMARRIED WOMEN
0.0/ 100
METRIC RATING
333rd/ 347
METRIC RANK
37.0%
BIRTHS TO UNMARRIED WOMEN
0.1/ 100
METRIC RATING
276th/ 347
METRIC RANK
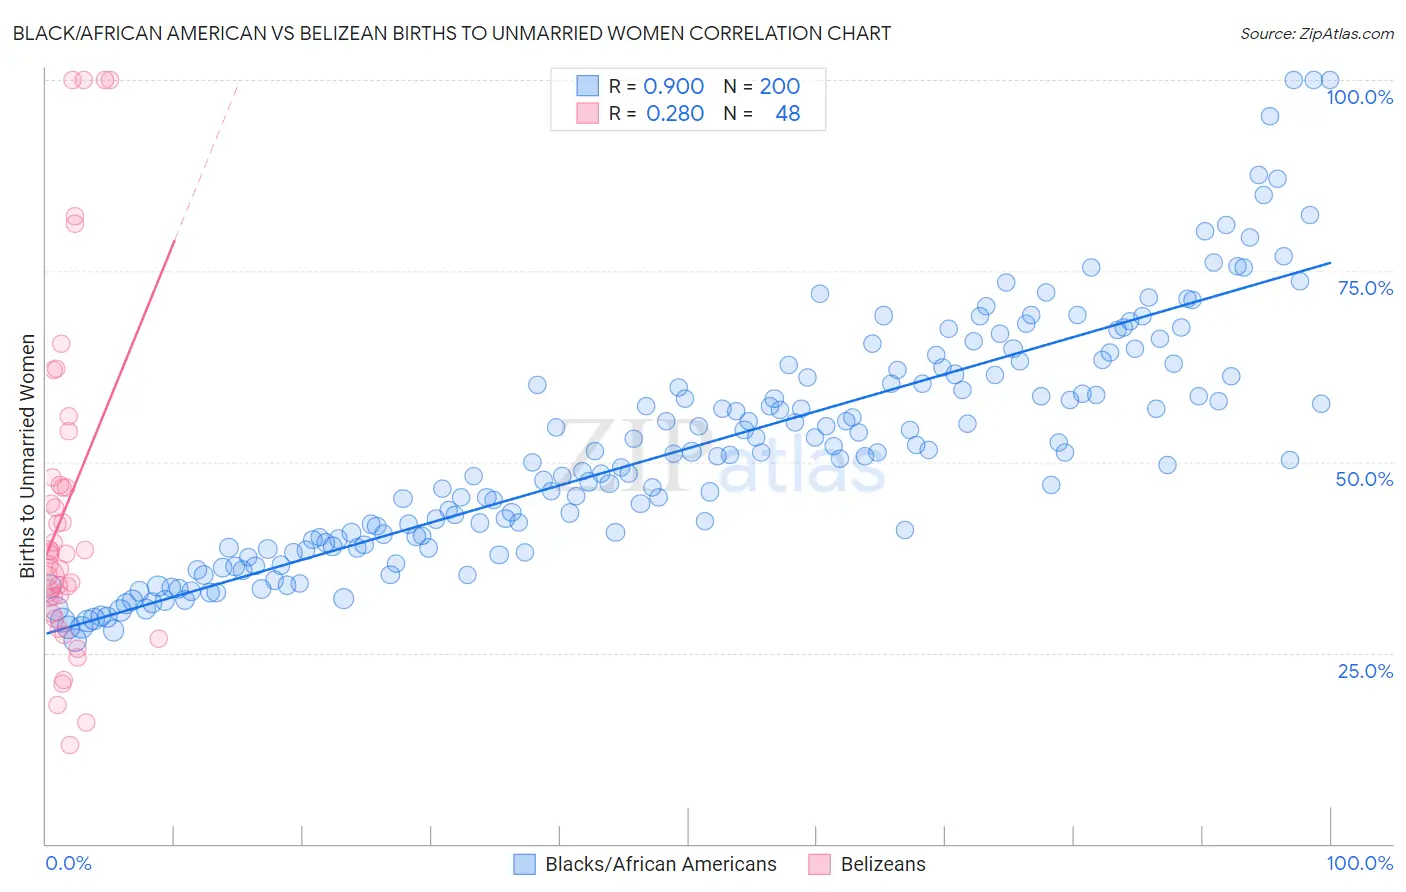
Black/African American vs Belizean Births to Unmarried Women Correlation Chart
The statistical analysis conducted on geographies consisting of 506,152,506 people shows a very strong positive correlation between the proportion of Blacks/African Americans and percentage of births to unmarried women in the United States with a correlation coefficient (R) of 0.900 and weighted average of 44.3%. Similarly, the statistical analysis conducted on geographies consisting of 141,847,597 people shows a weak positive correlation between the proportion of Belizeans and percentage of births to unmarried women in the United States with a correlation coefficient (R) of 0.280 and weighted average of 37.0%, a difference of 19.6%.
Births to Unmarried Women Correlation Summary
| Measurement | Black/African American | Belizean |
| Minimum | 26.7% | 13.0% |
| Maximum | 100.0% | 100.0% |
| Range | 73.3% | 87.0% |
| Mean | 51.8% | 44.0% |
| Median | 50.9% | 38.0% |
| Interquartile 25% (IQ1) | 39.1% | 31.1% |
| Interquartile 75% (IQ3) | 61.4% | 47.5% |
| Interquartile Range (IQR) | 22.4% | 16.3% |
| Standard Deviation (Sample) | 15.6% | 22.4% |
| Standard Deviation (Population) | 15.6% | 22.1% |
Similar Demographics by Births to Unmarried Women
Demographics Similar to Blacks/African Americans by Births to Unmarried Women
In terms of births to unmarried women, the demographic groups most similar to Blacks/African Americans are Yuman (44.4%, a difference of 0.17%), Colville (45.3%, a difference of 2.3%), Kiowa (43.1%, a difference of 2.7%), Native/Alaskan (43.0%, a difference of 3.0%), and Puerto Rican (45.7%, a difference of 3.1%).
| Demographics | Rating | Rank | Births to Unmarried Women |
| Immigrants | Cuba | 0.0 /100 | #326 | Tragic 41.5% |
| Tsimshian | 0.0 /100 | #327 | Tragic 42.2% |
| Immigrants | Cabo Verde | 0.0 /100 | #328 | Tragic 42.2% |
| Paiute | 0.0 /100 | #329 | Tragic 42.5% |
| Chippewa | 0.0 /100 | #330 | Tragic 42.6% |
| Natives/Alaskans | 0.0 /100 | #331 | Tragic 43.0% |
| Kiowa | 0.0 /100 | #332 | Tragic 43.1% |
| Blacks/African Americans | 0.0 /100 | #333 | Tragic 44.3% |
| Yuman | 0.0 /100 | #334 | Tragic 44.4% |
| Colville | 0.0 /100 | #335 | Tragic 45.3% |
| Puerto Ricans | 0.0 /100 | #336 | Tragic 45.7% |
| Houma | 0.0 /100 | #337 | Tragic 46.6% |
| Arapaho | 0.0 /100 | #338 | Tragic 47.1% |
| Lumbee | 0.0 /100 | #339 | Tragic 48.2% |
| Tohono O'odham | 0.0 /100 | #340 | Tragic 49.8% |
Demographics Similar to Belizeans by Births to Unmarried Women
In terms of births to unmarried women, the demographic groups most similar to Belizeans are Barbadian (37.0%, a difference of 0.19%), Cree (37.0%, a difference of 0.22%), Guatemalan (37.1%, a difference of 0.22%), Immigrants from Latin America (37.1%, a difference of 0.30%), and Mexican (36.9%, a difference of 0.31%).
| Demographics | Rating | Rank | Births to Unmarried Women |
| Senegalese | 0.1 /100 | #269 | Tragic 36.8% |
| Immigrants | Congo | 0.1 /100 | #270 | Tragic 36.8% |
| Immigrants | Barbados | 0.1 /100 | #271 | Tragic 36.8% |
| Choctaw | 0.1 /100 | #272 | Tragic 36.9% |
| Mexicans | 0.1 /100 | #273 | Tragic 36.9% |
| Cree | 0.1 /100 | #274 | Tragic 37.0% |
| Barbadians | 0.1 /100 | #275 | Tragic 37.0% |
| Belizeans | 0.1 /100 | #276 | Tragic 37.0% |
| Guatemalans | 0.1 /100 | #277 | Tragic 37.1% |
| Immigrants | Latin America | 0.1 /100 | #278 | Tragic 37.1% |
| West Indians | 0.1 /100 | #279 | Tragic 37.3% |
| Immigrants | St. Vincent and the Grenadines | 0.1 /100 | #280 | Tragic 37.3% |
| Immigrants | Belize | 0.1 /100 | #281 | Tragic 37.3% |
| Liberians | 0.0 /100 | #282 | Tragic 37.4% |
| Spanish American Indians | 0.0 /100 | #283 | Tragic 37.4% |