Immigrants from Philippines vs Mongolian Family Households
COMPARE
Immigrants from Philippines
Mongolian
Family Households
Family Households Comparison
Immigrants from Philippines
Mongolians
68.3%
FAMILY HOUSEHOLDS
100.0/ 100
METRIC RATING
10th/ 347
METRIC RANK
62.8%
FAMILY HOUSEHOLDS
0.1/ 100
METRIC RATING
285th/ 347
METRIC RANK
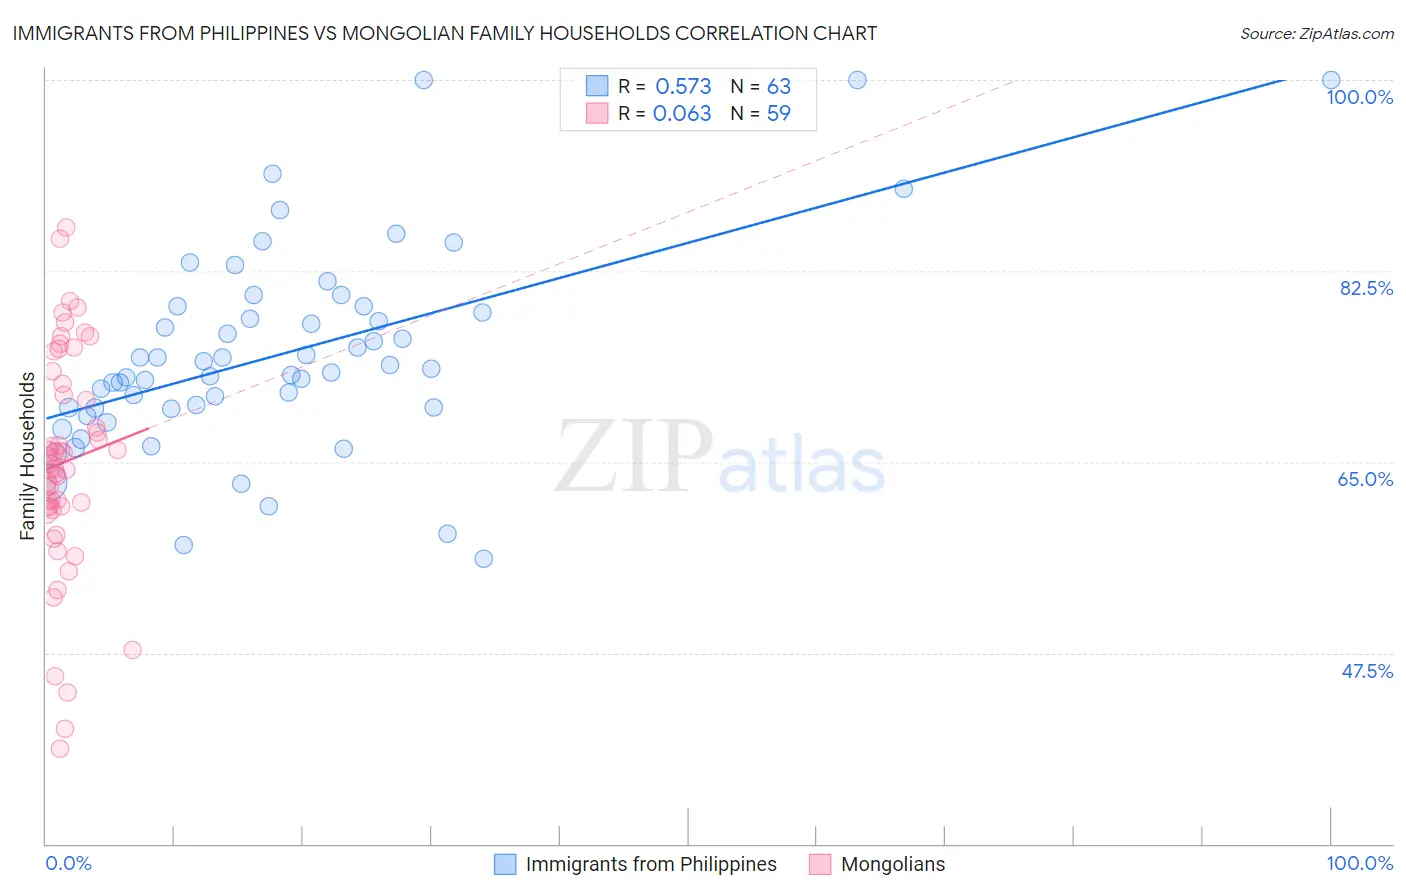
Immigrants from Philippines vs Mongolian Family Households Correlation Chart
The statistical analysis conducted on geographies consisting of 471,023,329 people shows a substantial positive correlation between the proportion of Immigrants from Philippines and percentage of family households in the United States with a correlation coefficient (R) of 0.573 and weighted average of 68.3%. Similarly, the statistical analysis conducted on geographies consisting of 140,293,840 people shows a slight positive correlation between the proportion of Mongolians and percentage of family households in the United States with a correlation coefficient (R) of 0.063 and weighted average of 62.8%, a difference of 8.8%.
Family Households Correlation Summary
| Measurement | Immigrants from Philippines | Mongolian |
| Minimum | 56.2% | 38.8% |
| Maximum | 100.0% | 86.5% |
| Range | 43.8% | 47.8% |
| Mean | 74.9% | 65.0% |
| Median | 73.6% | 64.9% |
| Interquartile 25% (IQ1) | 69.9% | 60.9% |
| Interquartile 75% (IQ3) | 79.3% | 72.2% |
| Interquartile Range (IQR) | 9.3% | 11.3% |
| Standard Deviation (Sample) | 9.3% | 10.1% |
| Standard Deviation (Population) | 9.2% | 10.0% |
Similar Demographics by Family Households
Demographics Similar to Immigrants from Philippines by Family Households
In terms of family households, the demographic groups most similar to Immigrants from Philippines are Native Hawaiian (68.4%, a difference of 0.070%), Immigrants from Central America (68.3%, a difference of 0.070%), Korean (68.3%, a difference of 0.10%), Pueblo (68.2%, a difference of 0.18%), and Immigrants from Cuba (68.2%, a difference of 0.19%).
| Demographics | Rating | Rank | Family Households |
| Tongans | 100.0 /100 | #3 | Exceptional 69.6% |
| Yakama | 100.0 /100 | #4 | Exceptional 69.3% |
| Yuman | 100.0 /100 | #5 | Exceptional 69.3% |
| Immigrants | Mexico | 100.0 /100 | #6 | Exceptional 69.1% |
| Mexicans | 100.0 /100 | #7 | Exceptional 69.0% |
| Immigrants | Fiji | 100.0 /100 | #8 | Exceptional 68.8% |
| Native Hawaiians | 100.0 /100 | #9 | Exceptional 68.4% |
| Immigrants | Philippines | 100.0 /100 | #10 | Exceptional 68.3% |
| Immigrants | Central America | 100.0 /100 | #11 | Exceptional 68.3% |
| Koreans | 100.0 /100 | #12 | Exceptional 68.3% |
| Pueblo | 100.0 /100 | #13 | Exceptional 68.2% |
| Immigrants | Cuba | 100.0 /100 | #14 | Exceptional 68.2% |
| Assyrians/Chaldeans/Syriacs | 100.0 /100 | #15 | Exceptional 68.2% |
| Immigrants | Vietnam | 100.0 /100 | #16 | Exceptional 68.2% |
| Chinese | 100.0 /100 | #17 | Exceptional 68.1% |
Demographics Similar to Mongolians by Family Households
In terms of family households, the demographic groups most similar to Mongolians are British West Indian (62.8%, a difference of 0.030%), Latvian (62.8%, a difference of 0.030%), Immigrants from Uganda (62.7%, a difference of 0.050%), Australian (62.8%, a difference of 0.10%), and Immigrants from Nepal (62.7%, a difference of 0.14%).
| Demographics | Rating | Rank | Family Households |
| Immigrants | Belgium | 0.2 /100 | #278 | Tragic 63.0% |
| Immigrants | Yemen | 0.2 /100 | #279 | Tragic 63.0% |
| Immigrants | Bulgaria | 0.2 /100 | #280 | Tragic 63.0% |
| Estonians | 0.2 /100 | #281 | Tragic 62.9% |
| New Zealanders | 0.1 /100 | #282 | Tragic 62.9% |
| Immigrants | Denmark | 0.1 /100 | #283 | Tragic 62.9% |
| Australians | 0.1 /100 | #284 | Tragic 62.8% |
| Mongolians | 0.1 /100 | #285 | Tragic 62.8% |
| British West Indians | 0.1 /100 | #286 | Tragic 62.8% |
| Latvians | 0.1 /100 | #287 | Tragic 62.8% |
| Immigrants | Uganda | 0.1 /100 | #288 | Tragic 62.7% |
| Immigrants | Nepal | 0.1 /100 | #289 | Tragic 62.7% |
| Immigrants | Grenada | 0.0 /100 | #290 | Tragic 62.6% |
| U.S. Virgin Islanders | 0.0 /100 | #291 | Tragic 62.6% |
| Immigrants | Burma/Myanmar | 0.0 /100 | #292 | Tragic 62.6% |