Immigrants from Philippines vs Mongolian Unemployment Among Ages 25 to 29 years
COMPARE
Immigrants from Philippines
Mongolian
Unemployment Among Ages 25 to 29 years
Unemployment Among Ages 25 to 29 years Comparison
Immigrants from Philippines
Mongolians
6.8%
UNEMPLOYMENT AMONG AGES 25 TO 29 YEARS
16.7/ 100
METRIC RATING
211th/ 347
METRIC RANK
6.2%
UNEMPLOYMENT AMONG AGES 25 TO 29 YEARS
99.2/ 100
METRIC RATING
44th/ 347
METRIC RANK
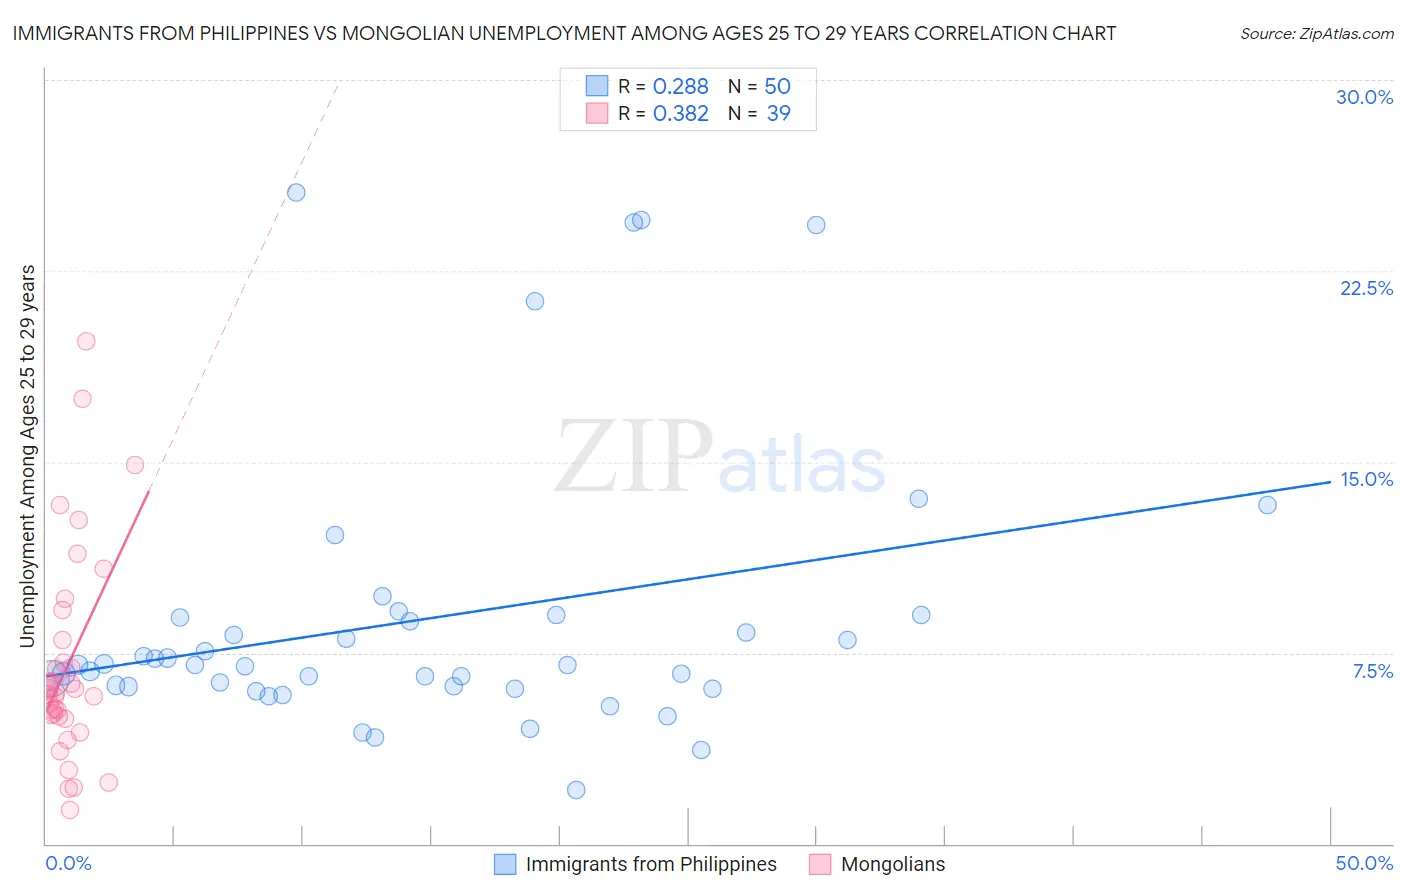
Immigrants from Philippines vs Mongolian Unemployment Among Ages 25 to 29 years Correlation Chart
The statistical analysis conducted on geographies consisting of 442,687,196 people shows a weak positive correlation between the proportion of Immigrants from Philippines and unemployment rate among population between the ages 25 and 29 in the United States with a correlation coefficient (R) of 0.288 and weighted average of 6.8%. Similarly, the statistical analysis conducted on geographies consisting of 138,299,651 people shows a mild positive correlation between the proportion of Mongolians and unemployment rate among population between the ages 25 and 29 in the United States with a correlation coefficient (R) of 0.382 and weighted average of 6.2%, a difference of 10.6%.
Unemployment Among Ages 25 to 29 years Correlation Summary
| Measurement | Immigrants from Philippines | Mongolian |
| Minimum | 2.1% | 1.3% |
| Maximum | 25.6% | 19.7% |
| Range | 23.5% | 18.4% |
| Mean | 8.8% | 7.0% |
| Median | 7.0% | 5.9% |
| Interquartile 25% (IQ1) | 6.2% | 5.0% |
| Interquartile 75% (IQ3) | 8.9% | 8.0% |
| Interquartile Range (IQR) | 2.7% | 3.0% |
| Standard Deviation (Sample) | 5.5% | 4.1% |
| Standard Deviation (Population) | 5.5% | 4.0% |
Similar Demographics by Unemployment Among Ages 25 to 29 years
Demographics Similar to Immigrants from Philippines by Unemployment Among Ages 25 to 29 years
In terms of unemployment among ages 25 to 29 years, the demographic groups most similar to Immigrants from Philippines are Canadian (6.8%, a difference of 0.030%), Hawaiian (6.8%, a difference of 0.050%), Immigrants from Cabo Verde (6.8%, a difference of 0.050%), Immigrants from Syria (6.8%, a difference of 0.17%), and Immigrants from Germany (6.8%, a difference of 0.23%).
| Demographics | Rating | Rank | Unemployment Among Ages 25 to 29 years |
| Scotch-Irish | 20.0 /100 | #204 | Poor 6.8% |
| Immigrants | England | 19.8 /100 | #205 | Poor 6.8% |
| Ugandans | 19.8 /100 | #206 | Poor 6.8% |
| Immigrants | Denmark | 19.0 /100 | #207 | Poor 6.8% |
| Immigrants | Germany | 18.8 /100 | #208 | Poor 6.8% |
| Hawaiians | 17.1 /100 | #209 | Poor 6.8% |
| Canadians | 16.9 /100 | #210 | Poor 6.8% |
| Immigrants | Philippines | 16.7 /100 | #211 | Poor 6.8% |
| Immigrants | Cabo Verde | 16.2 /100 | #212 | Poor 6.8% |
| Immigrants | Syria | 15.1 /100 | #213 | Poor 6.8% |
| Liberians | 14.7 /100 | #214 | Poor 6.8% |
| Spanish | 14.4 /100 | #215 | Poor 6.8% |
| Slovaks | 14.3 /100 | #216 | Poor 6.8% |
| Ute | 13.4 /100 | #217 | Poor 6.8% |
| Immigrants | Austria | 12.3 /100 | #218 | Poor 6.8% |
Demographics Similar to Mongolians by Unemployment Among Ages 25 to 29 years
In terms of unemployment among ages 25 to 29 years, the demographic groups most similar to Mongolians are Czech (6.2%, a difference of 0.040%), Jordanian (6.1%, a difference of 0.18%), Fijian (6.1%, a difference of 0.20%), Venezuelan (6.2%, a difference of 0.20%), and Immigrants from Kenya (6.1%, a difference of 0.25%).
| Demographics | Rating | Rank | Unemployment Among Ages 25 to 29 years |
| Immigrants | Serbia | 99.5 /100 | #37 | Exceptional 6.1% |
| Ethiopians | 99.4 /100 | #38 | Exceptional 6.1% |
| Indonesians | 99.3 /100 | #39 | Exceptional 6.1% |
| Immigrants | Kenya | 99.3 /100 | #40 | Exceptional 6.1% |
| Fijians | 99.3 /100 | #41 | Exceptional 6.1% |
| Jordanians | 99.3 /100 | #42 | Exceptional 6.1% |
| Czechs | 99.2 /100 | #43 | Exceptional 6.2% |
| Mongolians | 99.2 /100 | #44 | Exceptional 6.2% |
| Venezuelans | 99.1 /100 | #45 | Exceptional 6.2% |
| Immigrants | Lithuania | 99.0 /100 | #46 | Exceptional 6.2% |
| Latvians | 99.0 /100 | #47 | Exceptional 6.2% |
| Immigrants | Australia | 99.0 /100 | #48 | Exceptional 6.2% |
| German Russians | 99.0 /100 | #49 | Exceptional 6.2% |
| Soviet Union | 98.9 /100 | #50 | Exceptional 6.2% |
| Burmese | 98.9 /100 | #51 | Exceptional 6.2% |