Immigrants from Sudan vs Assyrian/Chaldean/Syriac Currently Married
COMPARE
Immigrants from Sudan
Assyrian/Chaldean/Syriac
Currently Married
Currently Married Comparison
Immigrants from Sudan
Assyrians/Chaldeans/Syriacs
43.5%
CURRENTLY MARRIED
0.1/ 100
METRIC RATING
269th/ 347
METRIC RANK
50.8%
CURRENTLY MARRIED
100.0/ 100
METRIC RATING
3rd/ 347
METRIC RANK
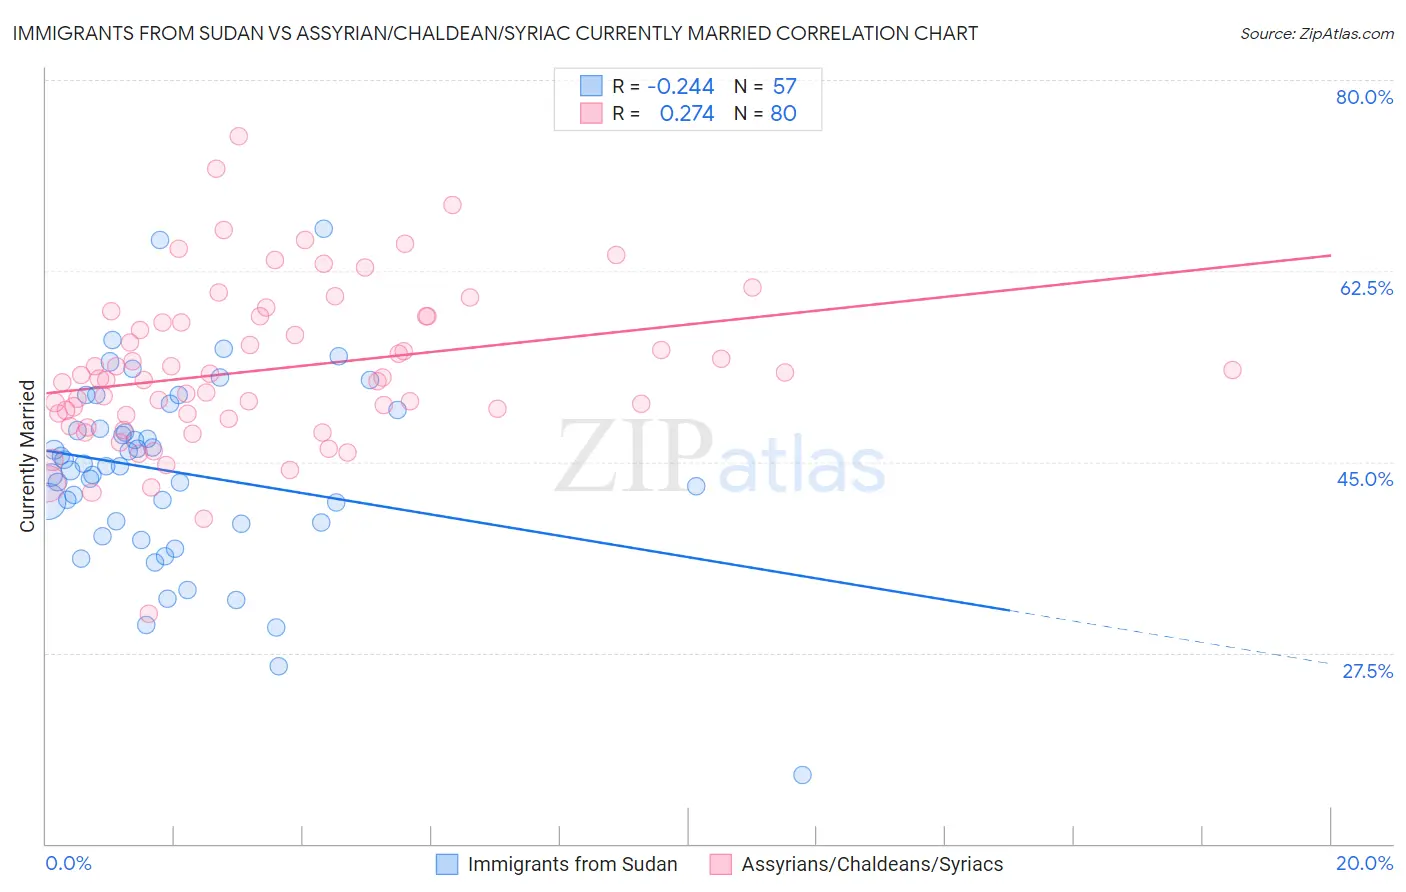
Immigrants from Sudan vs Assyrian/Chaldean/Syriac Currently Married Correlation Chart
The statistical analysis conducted on geographies consisting of 118,963,461 people shows a weak negative correlation between the proportion of Immigrants from Sudan and percentage of population currently married in the United States with a correlation coefficient (R) of -0.244 and weighted average of 43.5%. Similarly, the statistical analysis conducted on geographies consisting of 110,318,125 people shows a weak positive correlation between the proportion of Assyrians/Chaldeans/Syriacs and percentage of population currently married in the United States with a correlation coefficient (R) of 0.274 and weighted average of 50.8%, a difference of 16.7%.
Currently Married Correlation Summary
| Measurement | Immigrants from Sudan | Assyrian/Chaldean/Syriac |
| Minimum | 16.3% | 31.0% |
| Maximum | 66.4% | 74.8% |
| Range | 50.1% | 43.8% |
| Mean | 44.1% | 53.4% |
| Median | 44.6% | 52.6% |
| Interquartile 25% (IQ1) | 39.4% | 49.1% |
| Interquartile 75% (IQ3) | 48.9% | 58.1% |
| Interquartile Range (IQR) | 9.6% | 8.9% |
| Standard Deviation (Sample) | 8.8% | 7.4% |
| Standard Deviation (Population) | 8.7% | 7.3% |
Similar Demographics by Currently Married
Demographics Similar to Immigrants from Sudan by Currently Married
In terms of currently married, the demographic groups most similar to Immigrants from Sudan are Salvadoran (43.5%, a difference of 0.080%), Bermudan (43.5%, a difference of 0.090%), Spanish American Indian (43.6%, a difference of 0.12%), Immigrants from Eritrea (43.6%, a difference of 0.13%), and Indonesian (43.5%, a difference of 0.13%).
| Demographics | Rating | Rank | Currently Married |
| Bangladeshis | 0.1 /100 | #262 | Tragic 43.7% |
| Immigrants | Cuba | 0.1 /100 | #263 | Tragic 43.7% |
| Sudanese | 0.1 /100 | #264 | Tragic 43.7% |
| Immigrants | Bangladesh | 0.1 /100 | #265 | Tragic 43.6% |
| Ecuadorians | 0.1 /100 | #266 | Tragic 43.6% |
| Immigrants | Eritrea | 0.1 /100 | #267 | Tragic 43.6% |
| Spanish American Indians | 0.1 /100 | #268 | Tragic 43.6% |
| Immigrants | Sudan | 0.1 /100 | #269 | Tragic 43.5% |
| Salvadorans | 0.1 /100 | #270 | Tragic 43.5% |
| Bermudans | 0.1 /100 | #271 | Tragic 43.5% |
| Indonesians | 0.1 /100 | #272 | Tragic 43.5% |
| Yaqui | 0.1 /100 | #273 | Tragic 43.4% |
| Nigerians | 0.1 /100 | #274 | Tragic 43.4% |
| Colville | 0.1 /100 | #275 | Tragic 43.4% |
| Sierra Leoneans | 0.1 /100 | #276 | Tragic 43.4% |
Demographics Similar to Assyrians/Chaldeans/Syriacs by Currently Married
In terms of currently married, the demographic groups most similar to Assyrians/Chaldeans/Syriacs are Immigrants from Taiwan (50.7%, a difference of 0.080%), Thai (50.9%, a difference of 0.18%), Danish (50.5%, a difference of 0.63%), Norwegian (50.2%, a difference of 1.2%), and Immigrants from South Central Asia (50.0%, a difference of 1.5%).
| Demographics | Rating | Rank | Currently Married |
| Immigrants | India | 100.0 /100 | #1 | Exceptional 51.8% |
| Thais | 100.0 /100 | #2 | Exceptional 50.9% |
| Assyrians/Chaldeans/Syriacs | 100.0 /100 | #3 | Exceptional 50.8% |
| Immigrants | Taiwan | 100.0 /100 | #4 | Exceptional 50.7% |
| Danes | 100.0 /100 | #5 | Exceptional 50.5% |
| Norwegians | 100.0 /100 | #6 | Exceptional 50.2% |
| Immigrants | South Central Asia | 100.0 /100 | #7 | Exceptional 50.0% |
| Swedes | 100.0 /100 | #8 | Exceptional 50.0% |
| Czechs | 99.9 /100 | #9 | Exceptional 49.9% |
| Filipinos | 99.9 /100 | #10 | Exceptional 49.7% |
| English | 99.9 /100 | #11 | Exceptional 49.7% |
| Swiss | 99.9 /100 | #12 | Exceptional 49.7% |
| Dutch | 99.9 /100 | #13 | Exceptional 49.6% |
| Germans | 99.9 /100 | #14 | Exceptional 49.6% |
| Pennsylvania Germans | 99.9 /100 | #15 | Exceptional 49.6% |