Nicaraguan vs Aleut Family Households
COMPARE
Nicaraguan
Aleut
Family Households
Family Households Comparison
Nicaraguans
Aleuts
67.4%
FAMILY HOUSEHOLDS
100.0/ 100
METRIC RATING
29th/ 347
METRIC RANK
63.4%
FAMILY HOUSEHOLDS
1.9/ 100
METRIC RATING
239th/ 347
METRIC RANK
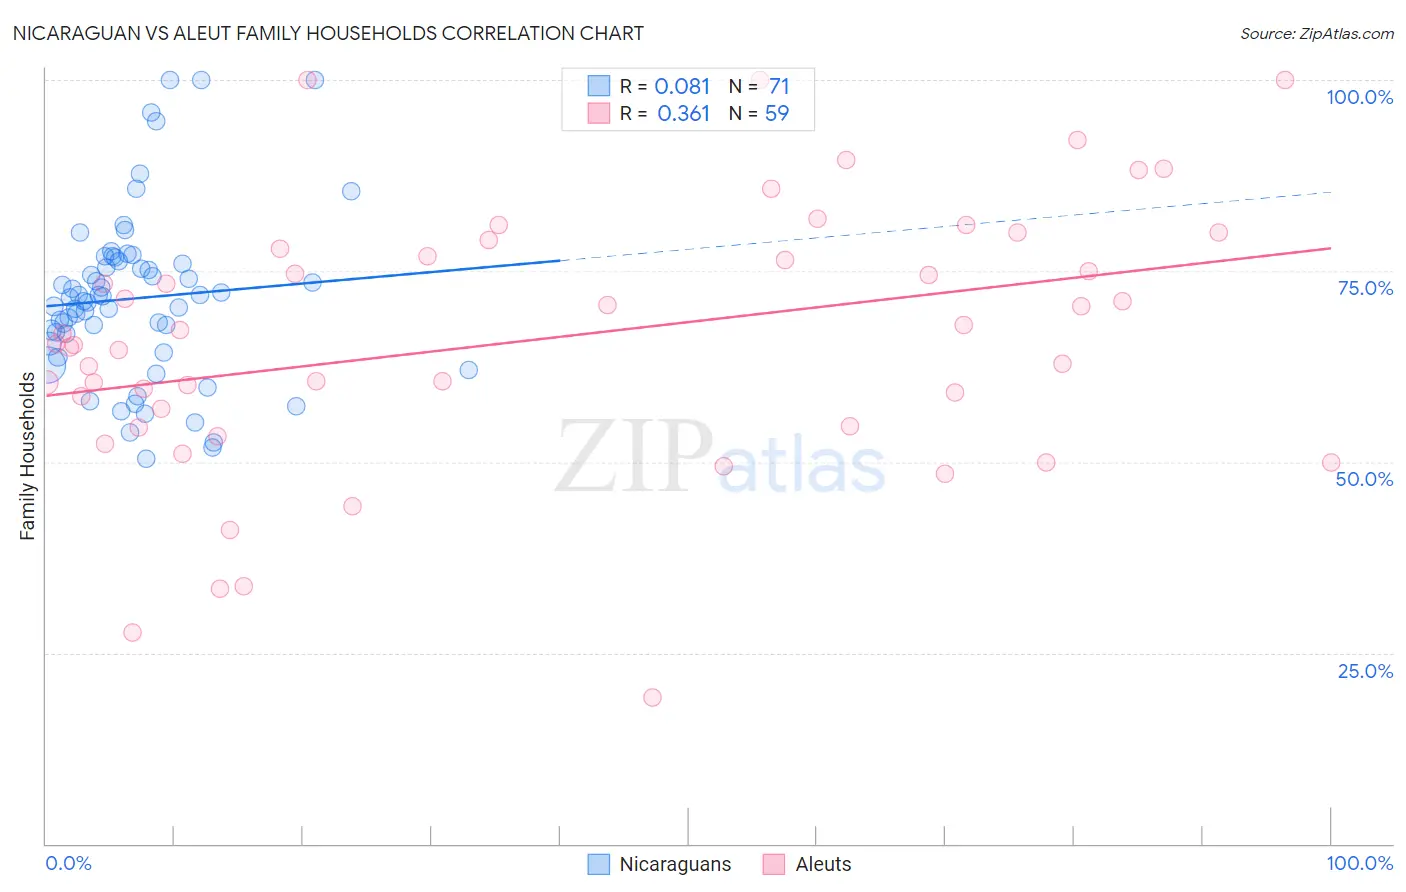
Nicaraguan vs Aleut Family Households Correlation Chart
The statistical analysis conducted on geographies consisting of 285,625,723 people shows a slight positive correlation between the proportion of Nicaraguans and percentage of family households in the United States with a correlation coefficient (R) of 0.081 and weighted average of 67.4%. Similarly, the statistical analysis conducted on geographies consisting of 61,774,066 people shows a mild positive correlation between the proportion of Aleuts and percentage of family households in the United States with a correlation coefficient (R) of 0.361 and weighted average of 63.4%, a difference of 6.2%.
Family Households Correlation Summary
| Measurement | Nicaraguan | Aleut |
| Minimum | 50.4% | 19.2% |
| Maximum | 100.0% | 100.0% |
| Range | 49.6% | 80.8% |
| Mean | 71.4% | 66.1% |
| Median | 71.5% | 65.4% |
| Interquartile 25% (IQ1) | 65.5% | 54.7% |
| Interquartile 75% (IQ3) | 76.3% | 77.9% |
| Interquartile Range (IQR) | 10.8% | 23.2% |
| Standard Deviation (Sample) | 11.0% | 17.3% |
| Standard Deviation (Population) | 10.9% | 17.2% |
Similar Demographics by Family Households
Demographics Similar to Nicaraguans by Family Households
In terms of family households, the demographic groups most similar to Nicaraguans are Hawaiian (67.4%, a difference of 0.070%), Hispanic or Latino (67.4%, a difference of 0.080%), Immigrants from India (67.4%, a difference of 0.13%), Immigrants from Nicaragua (67.5%, a difference of 0.14%), and Immigrants from South Eastern Asia (67.5%, a difference of 0.16%).
| Demographics | Rating | Rank | Family Households |
| Sri Lankans | 100.0 /100 | #22 | Exceptional 67.7% |
| Immigrants | Pakistan | 100.0 /100 | #23 | Exceptional 67.7% |
| Immigrants | South Eastern Asia | 100.0 /100 | #24 | Exceptional 67.5% |
| Immigrants | Nicaragua | 100.0 /100 | #25 | Exceptional 67.5% |
| Immigrants | India | 100.0 /100 | #26 | Exceptional 67.4% |
| Hispanics or Latinos | 100.0 /100 | #27 | Exceptional 67.4% |
| Hawaiians | 100.0 /100 | #28 | Exceptional 67.4% |
| Nicaraguans | 100.0 /100 | #29 | Exceptional 67.4% |
| Immigrants | Peru | 100.0 /100 | #30 | Exceptional 67.2% |
| Immigrants | Latin America | 100.0 /100 | #31 | Exceptional 67.2% |
| Nepalese | 100.0 /100 | #32 | Exceptional 67.2% |
| Salvadorans | 100.0 /100 | #33 | Exceptional 67.2% |
| Thais | 100.0 /100 | #34 | Exceptional 67.2% |
| Tohono O'odham | 100.0 /100 | #35 | Exceptional 67.1% |
| Peruvians | 100.0 /100 | #36 | Exceptional 67.1% |
Demographics Similar to Aleuts by Family Households
In terms of family households, the demographic groups most similar to Aleuts are South African (63.4%, a difference of 0.0%), Immigrants from St. Vincent and the Grenadines (63.4%, a difference of 0.010%), Immigrants from Israel (63.4%, a difference of 0.010%), Comanche (63.5%, a difference of 0.030%), and Immigrants from Zimbabwe (63.5%, a difference of 0.030%).
| Demographics | Rating | Rank | Family Households |
| Immigrants | Northern Africa | 2.6 /100 | #232 | Tragic 63.5% |
| Immigrants | Armenia | 2.6 /100 | #233 | Tragic 63.5% |
| Finns | 2.3 /100 | #234 | Tragic 63.5% |
| Albanians | 2.2 /100 | #235 | Tragic 63.5% |
| Ghanaians | 2.1 /100 | #236 | Tragic 63.5% |
| Comanche | 2.1 /100 | #237 | Tragic 63.5% |
| Immigrants | Zimbabwe | 2.0 /100 | #238 | Tragic 63.5% |
| Aleuts | 1.9 /100 | #239 | Tragic 63.4% |
| South Africans | 1.9 /100 | #240 | Tragic 63.4% |
| Immigrants | St. Vincent and the Grenadines | 1.9 /100 | #241 | Tragic 63.4% |
| Immigrants | Israel | 1.8 /100 | #242 | Tragic 63.4% |
| Immigrants | Czechoslovakia | 1.8 /100 | #243 | Tragic 63.4% |
| Eastern Europeans | 1.6 /100 | #244 | Tragic 63.4% |
| Immigrants | Dominica | 1.6 /100 | #245 | Tragic 63.4% |
| Immigrants | Ghana | 1.6 /100 | #246 | Tragic 63.4% |