Nicaraguan vs Ute Family Households
COMPARE
Nicaraguan
Ute
Family Households
Family Households Comparison
Nicaraguans
Ute
67.4%
FAMILY HOUSEHOLDS
100.0/ 100
METRIC RATING
29th/ 347
METRIC RANK
64.3%
FAMILY HOUSEHOLDS
54.6/ 100
METRIC RATING
171st/ 347
METRIC RANK
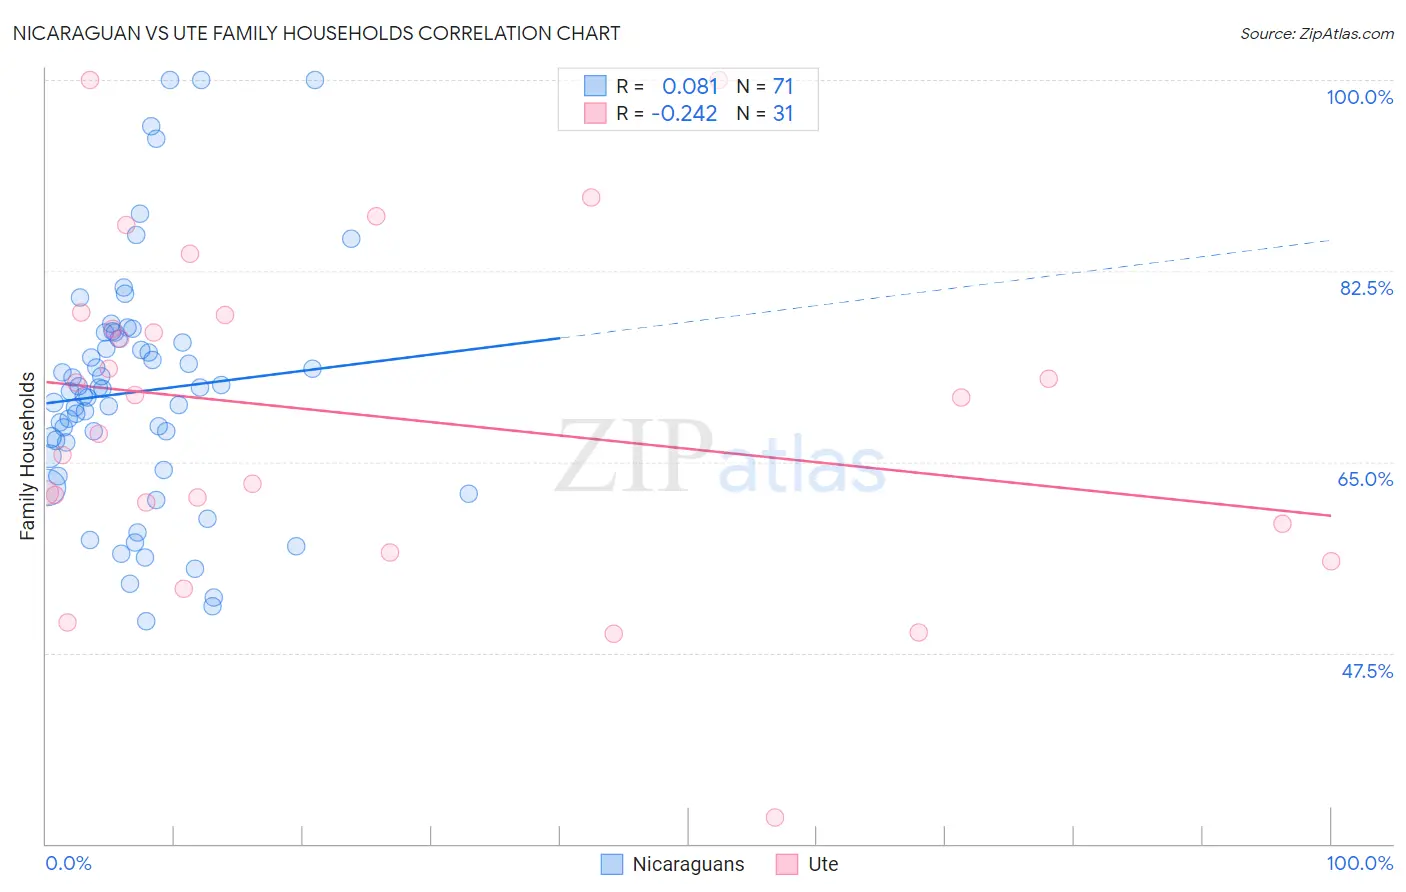
Nicaraguan vs Ute Family Households Correlation Chart
The statistical analysis conducted on geographies consisting of 285,625,723 people shows a slight positive correlation between the proportion of Nicaraguans and percentage of family households in the United States with a correlation coefficient (R) of 0.081 and weighted average of 67.4%. Similarly, the statistical analysis conducted on geographies consisting of 55,658,478 people shows a weak negative correlation between the proportion of Ute and percentage of family households in the United States with a correlation coefficient (R) of -0.242 and weighted average of 64.3%, a difference of 4.7%.
Family Households Correlation Summary
| Measurement | Nicaraguan | Ute |
| Minimum | 50.4% | 32.4% |
| Maximum | 100.0% | 100.0% |
| Range | 49.6% | 67.6% |
| Mean | 71.4% | 69.2% |
| Median | 71.5% | 70.9% |
| Interquartile 25% (IQ1) | 65.5% | 59.4% |
| Interquartile 75% (IQ3) | 76.3% | 78.5% |
| Interquartile Range (IQR) | 10.8% | 19.1% |
| Standard Deviation (Sample) | 11.0% | 15.3% |
| Standard Deviation (Population) | 10.9% | 15.0% |
Similar Demographics by Family Households
Demographics Similar to Nicaraguans by Family Households
In terms of family households, the demographic groups most similar to Nicaraguans are Hawaiian (67.4%, a difference of 0.070%), Hispanic or Latino (67.4%, a difference of 0.080%), Immigrants from India (67.4%, a difference of 0.13%), Immigrants from Nicaragua (67.5%, a difference of 0.14%), and Immigrants from South Eastern Asia (67.5%, a difference of 0.16%).
| Demographics | Rating | Rank | Family Households |
| Sri Lankans | 100.0 /100 | #22 | Exceptional 67.7% |
| Immigrants | Pakistan | 100.0 /100 | #23 | Exceptional 67.7% |
| Immigrants | South Eastern Asia | 100.0 /100 | #24 | Exceptional 67.5% |
| Immigrants | Nicaragua | 100.0 /100 | #25 | Exceptional 67.5% |
| Immigrants | India | 100.0 /100 | #26 | Exceptional 67.4% |
| Hispanics or Latinos | 100.0 /100 | #27 | Exceptional 67.4% |
| Hawaiians | 100.0 /100 | #28 | Exceptional 67.4% |
| Nicaraguans | 100.0 /100 | #29 | Exceptional 67.4% |
| Immigrants | Peru | 100.0 /100 | #30 | Exceptional 67.2% |
| Immigrants | Latin America | 100.0 /100 | #31 | Exceptional 67.2% |
| Nepalese | 100.0 /100 | #32 | Exceptional 67.2% |
| Salvadorans | 100.0 /100 | #33 | Exceptional 67.2% |
| Thais | 100.0 /100 | #34 | Exceptional 67.2% |
| Tohono O'odham | 100.0 /100 | #35 | Exceptional 67.1% |
| Peruvians | 100.0 /100 | #36 | Exceptional 67.1% |
Demographics Similar to Ute by Family Households
In terms of family households, the demographic groups most similar to Ute are Dutch West Indian (64.3%, a difference of 0.010%), Iraqi (64.4%, a difference of 0.020%), Armenian (64.4%, a difference of 0.020%), Immigrants from Sierra Leone (64.3%, a difference of 0.030%), and Irish (64.4%, a difference of 0.040%).
| Demographics | Rating | Rank | Family Households |
| Immigrants | Nigeria | 60.1 /100 | #164 | Good 64.4% |
| Immigrants | Southern Europe | 60.0 /100 | #165 | Good 64.4% |
| Scotch-Irish | 59.2 /100 | #166 | Average 64.4% |
| Irish | 57.9 /100 | #167 | Average 64.4% |
| Hondurans | 57.5 /100 | #168 | Average 64.4% |
| Iraqis | 56.0 /100 | #169 | Average 64.4% |
| Armenians | 55.9 /100 | #170 | Average 64.4% |
| Ute | 54.6 /100 | #171 | Average 64.3% |
| Dutch West Indians | 53.9 /100 | #172 | Average 64.3% |
| Immigrants | Sierra Leone | 52.5 /100 | #173 | Average 64.3% |
| Immigrants | Germany | 50.0 /100 | #174 | Average 64.3% |
| Bangladeshis | 44.3 /100 | #175 | Average 64.3% |
| Vietnamese | 43.6 /100 | #176 | Average 64.2% |
| Immigrants | Micronesia | 42.3 /100 | #177 | Average 64.2% |
| Jamaicans | 40.6 /100 | #178 | Average 64.2% |