Spanish American vs Potawatomi Family Households
COMPARE
Spanish American
Potawatomi
Family Households
Family Households Comparison
Spanish Americans
Potawatomi
64.1%
FAMILY HOUSEHOLDS
30.1/ 100
METRIC RATING
186th/ 347
METRIC RANK
63.3%
FAMILY HOUSEHOLDS
1.0/ 100
METRIC RATING
255th/ 347
METRIC RANK
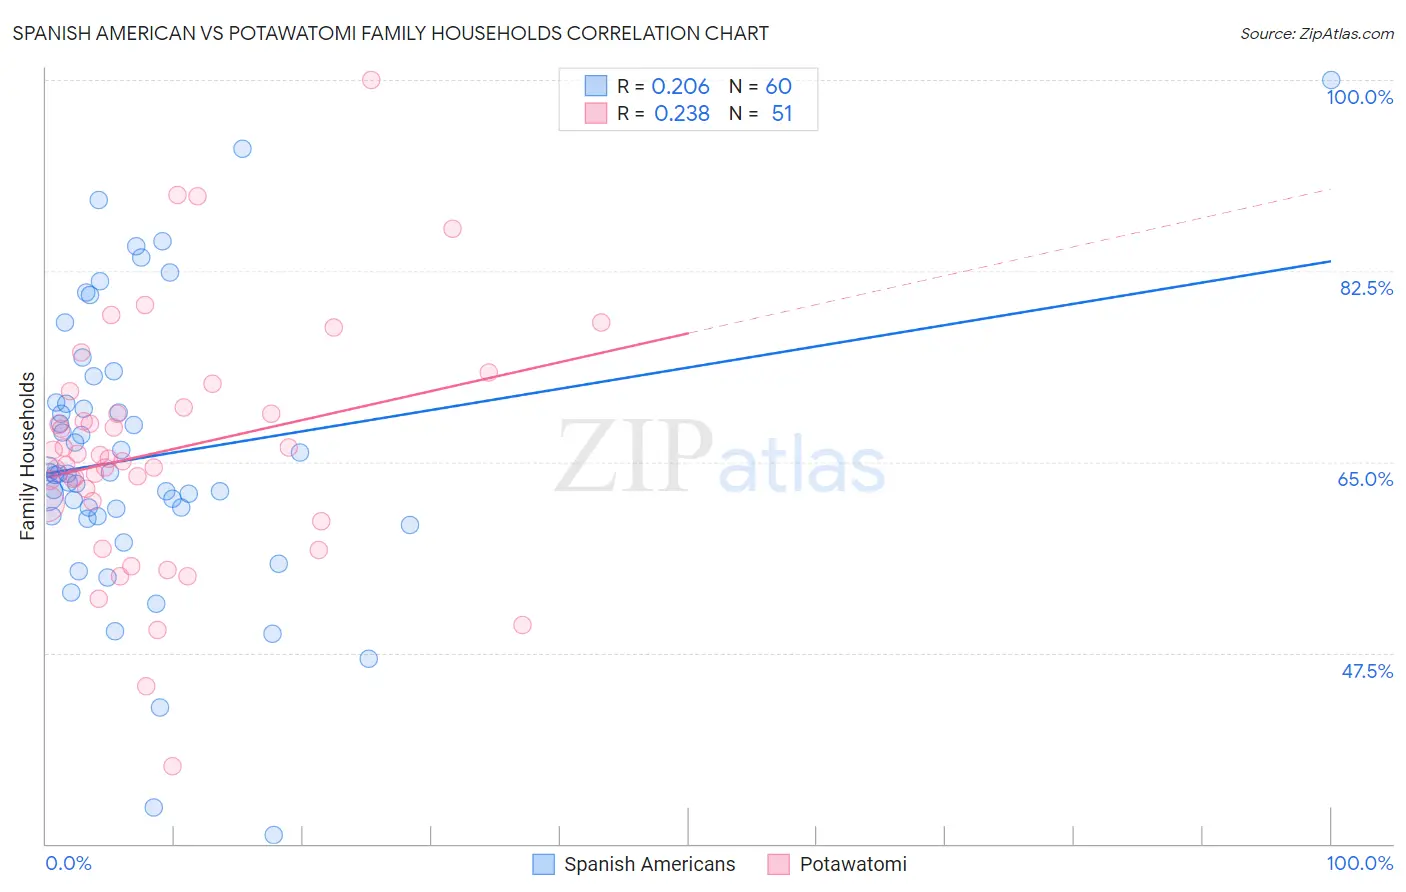
Spanish American vs Potawatomi Family Households Correlation Chart
The statistical analysis conducted on geographies consisting of 103,168,621 people shows a weak positive correlation between the proportion of Spanish Americans and percentage of family households in the United States with a correlation coefficient (R) of 0.206 and weighted average of 64.1%. Similarly, the statistical analysis conducted on geographies consisting of 117,759,902 people shows a weak positive correlation between the proportion of Potawatomi and percentage of family households in the United States with a correlation coefficient (R) of 0.238 and weighted average of 63.3%, a difference of 1.3%.
Family Households Correlation Summary
| Measurement | Spanish American | Potawatomi |
| Minimum | 30.8% | 37.1% |
| Maximum | 100.0% | 100.0% |
| Range | 69.2% | 62.9% |
| Mean | 65.4% | 66.1% |
| Median | 63.9% | 65.3% |
| Interquartile 25% (IQ1) | 60.0% | 61.2% |
| Interquartile 75% (IQ3) | 70.4% | 70.0% |
| Interquartile Range (IQR) | 10.4% | 8.8% |
| Standard Deviation (Sample) | 12.9% | 11.3% |
| Standard Deviation (Population) | 12.8% | 11.2% |
Similar Demographics by Family Households
Demographics Similar to Spanish Americans by Family Households
In terms of family households, the demographic groups most similar to Spanish Americans are Immigrants from Iran (64.1%, a difference of 0.010%), Northern European (64.1%, a difference of 0.030%), Puerto Rican (64.2%, a difference of 0.050%), Creek (64.2%, a difference of 0.060%), and Paraguayan (64.1%, a difference of 0.060%).
| Demographics | Rating | Rank | Family Households |
| Immigrants | Ukraine | 38.2 /100 | #179 | Fair 64.2% |
| Immigrants | Honduras | 35.0 /100 | #180 | Fair 64.2% |
| Immigrants | Trinidad and Tobago | 34.9 /100 | #181 | Fair 64.2% |
| Ukrainians | 34.6 /100 | #182 | Fair 64.2% |
| Creek | 34.1 /100 | #183 | Fair 64.2% |
| Puerto Ricans | 33.4 /100 | #184 | Fair 64.2% |
| Immigrants | Iran | 30.4 /100 | #185 | Fair 64.1% |
| Spanish Americans | 30.1 /100 | #186 | Fair 64.1% |
| Northern Europeans | 28.2 /100 | #187 | Fair 64.1% |
| Paraguayans | 26.7 /100 | #188 | Fair 64.1% |
| Immigrants | Western Asia | 25.3 /100 | #189 | Fair 64.1% |
| Zimbabweans | 24.7 /100 | #190 | Fair 64.1% |
| Arabs | 24.5 /100 | #191 | Fair 64.1% |
| Lithuanians | 23.8 /100 | #192 | Fair 64.0% |
| French | 23.7 /100 | #193 | Fair 64.0% |
Demographics Similar to Potawatomi by Family Households
In terms of family households, the demographic groups most similar to Potawatomi are Slovak (63.3%, a difference of 0.020%), Luxembourger (63.3%, a difference of 0.020%), Immigrants from Dominican Republic (63.3%, a difference of 0.030%), Bahamian (63.3%, a difference of 0.050%), and Icelander (63.3%, a difference of 0.060%).
| Demographics | Rating | Rank | Family Households |
| Dominicans | 1.5 /100 | #248 | Tragic 63.4% |
| Russians | 1.4 /100 | #249 | Tragic 63.4% |
| Immigrants | Japan | 1.4 /100 | #250 | Tragic 63.4% |
| Taiwanese | 1.2 /100 | #251 | Tragic 63.3% |
| Bahamians | 1.1 /100 | #252 | Tragic 63.3% |
| Immigrants | Dominican Republic | 1.0 /100 | #253 | Tragic 63.3% |
| Slovaks | 1.0 /100 | #254 | Tragic 63.3% |
| Potawatomi | 1.0 /100 | #255 | Tragic 63.3% |
| Luxembourgers | 0.9 /100 | #256 | Tragic 63.3% |
| Icelanders | 0.8 /100 | #257 | Tragic 63.3% |
| Immigrants | Barbados | 0.7 /100 | #258 | Tragic 63.2% |
| Immigrants | Western Europe | 0.6 /100 | #259 | Tragic 63.2% |
| Cypriots | 0.6 /100 | #260 | Tragic 63.2% |
| Immigrants | Russia | 0.6 /100 | #261 | Tragic 63.2% |
| Immigrants | Ireland | 0.6 /100 | #262 | Tragic 63.2% |