U.S. Virgin Islander vs Choctaw Married-couple Households
COMPARE
U.S. Virgin Islander
Choctaw
Married-couple Households
Married-couple Households Comparison
U.S. Virgin Islanders
Choctaw
39.8%
MARRIED-COUPLE HOUSEHOLDS
0.0/ 100
METRIC RATING
326th/ 347
METRIC RANK
46.0%
MARRIED-COUPLE HOUSEHOLDS
24.9/ 100
METRIC RATING
191st/ 347
METRIC RANK
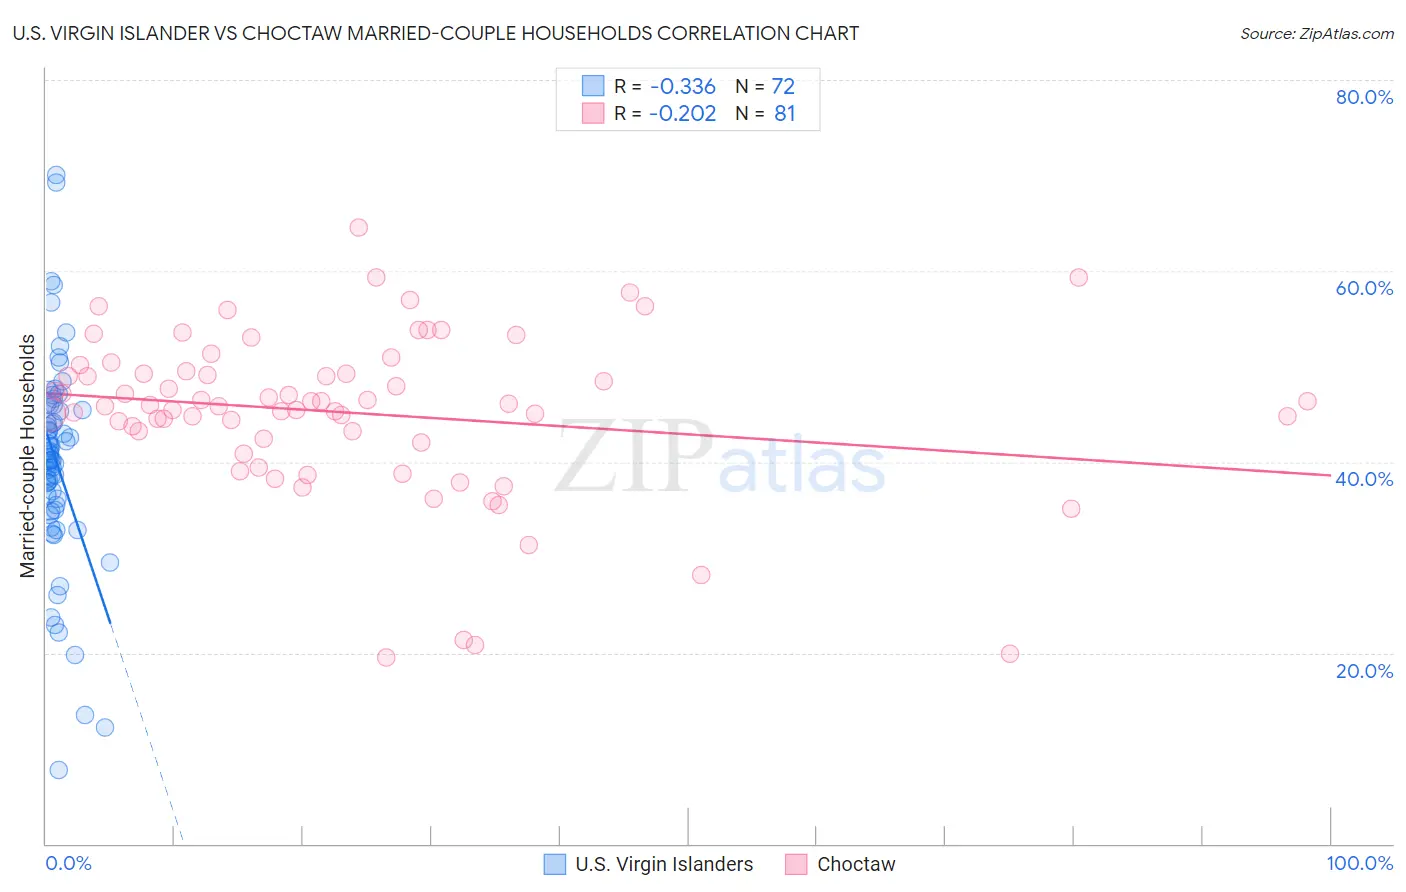
U.S. Virgin Islander vs Choctaw Married-couple Households Correlation Chart
The statistical analysis conducted on geographies consisting of 87,508,365 people shows a mild negative correlation between the proportion of U.S. Virgin Islanders and percentage of married-couple family households in the United States with a correlation coefficient (R) of -0.336 and weighted average of 39.8%. Similarly, the statistical analysis conducted on geographies consisting of 269,626,199 people shows a weak negative correlation between the proportion of Choctaw and percentage of married-couple family households in the United States with a correlation coefficient (R) of -0.202 and weighted average of 46.0%, a difference of 15.5%.
Married-couple Households Correlation Summary
| Measurement | U.S. Virgin Islander | Choctaw |
| Minimum | 7.8% | 19.5% |
| Maximum | 70.0% | 64.6% |
| Range | 62.2% | 45.1% |
| Mean | 40.0% | 45.2% |
| Median | 40.6% | 45.9% |
| Interquartile 25% (IQ1) | 35.2% | 42.3% |
| Interquartile 75% (IQ3) | 45.7% | 49.4% |
| Interquartile Range (IQR) | 10.5% | 7.1% |
| Standard Deviation (Sample) | 11.0% | 8.6% |
| Standard Deviation (Population) | 10.9% | 8.6% |
Similar Demographics by Married-couple Households
Demographics Similar to U.S. Virgin Islanders by Married-couple Households
In terms of married-couple households, the demographic groups most similar to U.S. Virgin Islanders are Pueblo (40.0%, a difference of 0.46%), Lumbee (39.6%, a difference of 0.47%), Navajo (40.1%, a difference of 0.69%), Immigrants from Zaire (40.1%, a difference of 0.70%), and Puerto Rican (40.1%, a difference of 0.70%).
| Demographics | Rating | Rank | Married-couple Households |
| Bahamians | 0.0 /100 | #319 | Tragic 40.5% |
| West Indians | 0.0 /100 | #320 | Tragic 40.3% |
| Immigrants | Liberia | 0.0 /100 | #321 | Tragic 40.3% |
| Immigrants | Zaire | 0.0 /100 | #322 | Tragic 40.1% |
| Puerto Ricans | 0.0 /100 | #323 | Tragic 40.1% |
| Navajo | 0.0 /100 | #324 | Tragic 40.1% |
| Pueblo | 0.0 /100 | #325 | Tragic 40.0% |
| U.S. Virgin Islanders | 0.0 /100 | #326 | Tragic 39.8% |
| Lumbee | 0.0 /100 | #327 | Tragic 39.6% |
| Barbadians | 0.0 /100 | #328 | Tragic 39.4% |
| Immigrants | Dominica | 0.0 /100 | #329 | Tragic 39.4% |
| Immigrants | Barbados | 0.0 /100 | #330 | Tragic 39.2% |
| Immigrants | Congo | 0.0 /100 | #331 | Tragic 39.0% |
| Somalis | 0.0 /100 | #332 | Tragic 39.0% |
| Immigrants | West Indies | 0.0 /100 | #333 | Tragic 39.0% |
Demographics Similar to Choctaw by Married-couple Households
In terms of married-couple households, the demographic groups most similar to Choctaw are Immigrants from Northern Africa (46.0%, a difference of 0.020%), Immigrants from Kuwait (46.0%, a difference of 0.030%), Taiwanese (45.9%, a difference of 0.080%), Mexican American Indian (45.9%, a difference of 0.080%), and Immigrants from Latvia (46.0%, a difference of 0.10%).
| Demographics | Rating | Rank | Married-couple Households |
| Immigrants | Switzerland | 36.9 /100 | #184 | Fair 46.2% |
| Brazilians | 35.9 /100 | #185 | Fair 46.2% |
| Albanians | 31.1 /100 | #186 | Fair 46.1% |
| Fijians | 29.2 /100 | #187 | Fair 46.1% |
| South American Indians | 28.4 /100 | #188 | Fair 46.0% |
| Immigrants | Latvia | 26.9 /100 | #189 | Fair 46.0% |
| Immigrants | Kuwait | 25.6 /100 | #190 | Fair 46.0% |
| Choctaw | 24.9 /100 | #191 | Fair 46.0% |
| Immigrants | Northern Africa | 24.6 /100 | #192 | Fair 46.0% |
| Taiwanese | 23.4 /100 | #193 | Fair 45.9% |
| Mexican American Indians | 23.3 /100 | #194 | Fair 45.9% |
| Chickasaw | 22.7 /100 | #195 | Fair 45.9% |
| Immigrants | South America | 22.2 /100 | #196 | Fair 45.9% |
| Cambodians | 21.3 /100 | #197 | Fair 45.9% |
| Ottawa | 19.4 /100 | #198 | Poor 45.8% |