U.S. Virgin Islander vs Panamanian Married-couple Households
COMPARE
U.S. Virgin Islander
Panamanian
Married-couple Households
Married-couple Households Comparison
U.S. Virgin Islanders
Panamanians
39.8%
MARRIED-COUPLE HOUSEHOLDS
0.0/ 100
METRIC RATING
326th/ 347
METRIC RANK
45.2%
MARRIED-COUPLE HOUSEHOLDS
5.5/ 100
METRIC RATING
217th/ 347
METRIC RANK
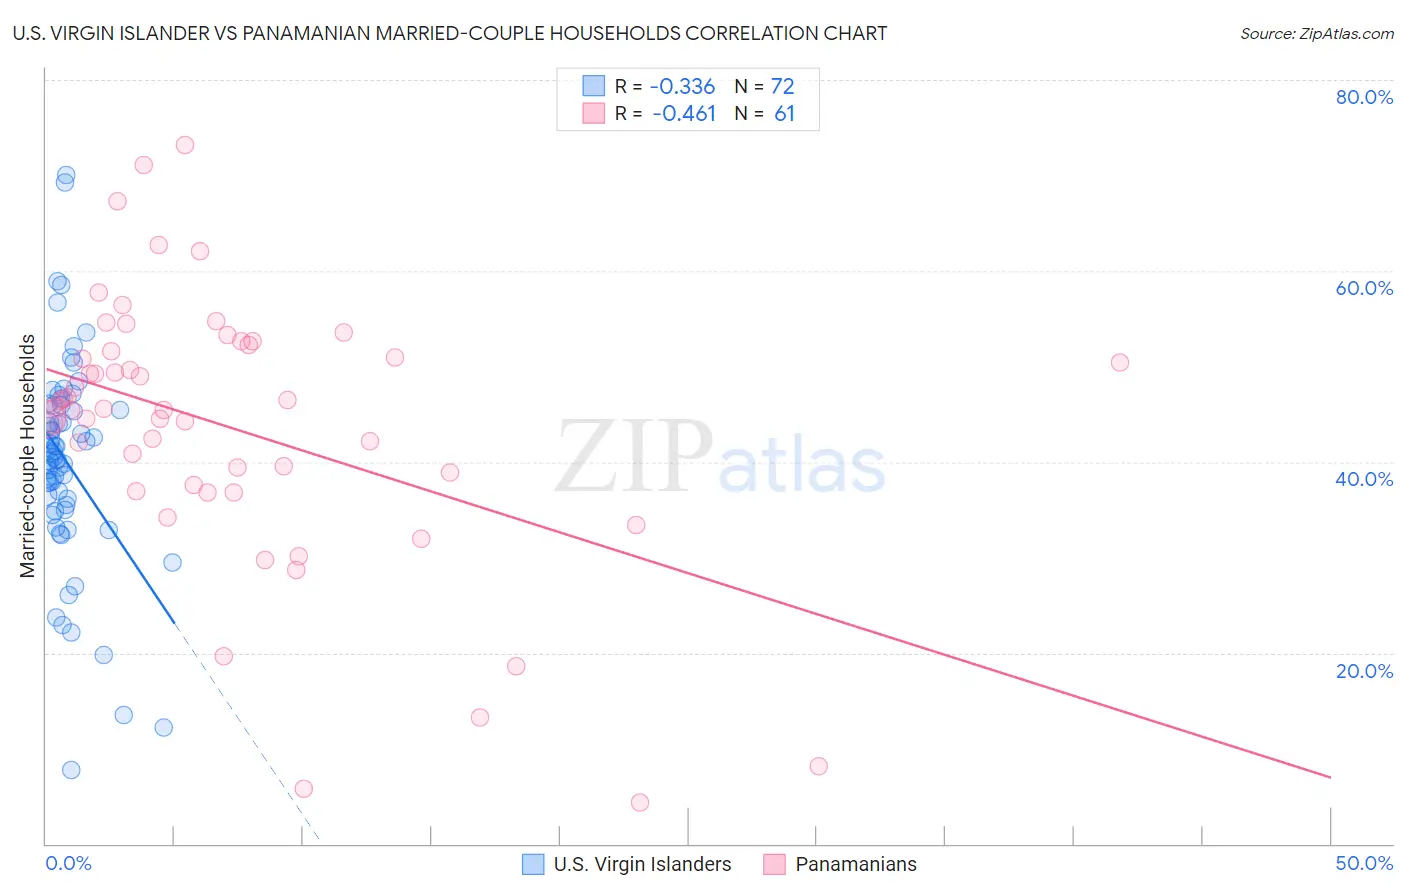
U.S. Virgin Islander vs Panamanian Married-couple Households Correlation Chart
The statistical analysis conducted on geographies consisting of 87,508,365 people shows a mild negative correlation between the proportion of U.S. Virgin Islanders and percentage of married-couple family households in the United States with a correlation coefficient (R) of -0.336 and weighted average of 39.8%. Similarly, the statistical analysis conducted on geographies consisting of 281,067,413 people shows a moderate negative correlation between the proportion of Panamanians and percentage of married-couple family households in the United States with a correlation coefficient (R) of -0.461 and weighted average of 45.2%, a difference of 13.6%.
Married-couple Households Correlation Summary
| Measurement | U.S. Virgin Islander | Panamanian |
| Minimum | 7.8% | 4.4% |
| Maximum | 70.0% | 73.1% |
| Range | 62.2% | 68.8% |
| Mean | 40.0% | 43.6% |
| Median | 40.6% | 45.6% |
| Interquartile 25% (IQ1) | 35.2% | 37.2% |
| Interquartile 75% (IQ3) | 45.7% | 51.9% |
| Interquartile Range (IQR) | 10.5% | 14.7% |
| Standard Deviation (Sample) | 11.0% | 14.2% |
| Standard Deviation (Population) | 10.9% | 14.0% |
Similar Demographics by Married-couple Households
Demographics Similar to U.S. Virgin Islanders by Married-couple Households
In terms of married-couple households, the demographic groups most similar to U.S. Virgin Islanders are Pueblo (40.0%, a difference of 0.46%), Lumbee (39.6%, a difference of 0.47%), Navajo (40.1%, a difference of 0.69%), Immigrants from Zaire (40.1%, a difference of 0.70%), and Puerto Rican (40.1%, a difference of 0.70%).
| Demographics | Rating | Rank | Married-couple Households |
| Bahamians | 0.0 /100 | #319 | Tragic 40.5% |
| West Indians | 0.0 /100 | #320 | Tragic 40.3% |
| Immigrants | Liberia | 0.0 /100 | #321 | Tragic 40.3% |
| Immigrants | Zaire | 0.0 /100 | #322 | Tragic 40.1% |
| Puerto Ricans | 0.0 /100 | #323 | Tragic 40.1% |
| Navajo | 0.0 /100 | #324 | Tragic 40.1% |
| Pueblo | 0.0 /100 | #325 | Tragic 40.0% |
| U.S. Virgin Islanders | 0.0 /100 | #326 | Tragic 39.8% |
| Lumbee | 0.0 /100 | #327 | Tragic 39.6% |
| Barbadians | 0.0 /100 | #328 | Tragic 39.4% |
| Immigrants | Dominica | 0.0 /100 | #329 | Tragic 39.4% |
| Immigrants | Barbados | 0.0 /100 | #330 | Tragic 39.2% |
| Immigrants | Congo | 0.0 /100 | #331 | Tragic 39.0% |
| Somalis | 0.0 /100 | #332 | Tragic 39.0% |
| Immigrants | West Indies | 0.0 /100 | #333 | Tragic 39.0% |
Demographics Similar to Panamanians by Married-couple Households
In terms of married-couple households, the demographic groups most similar to Panamanians are Immigrants from Nepal (45.2%, a difference of 0.020%), Immigrants from Portugal (45.2%, a difference of 0.020%), Immigrants from the Azores (45.2%, a difference of 0.030%), Nicaraguan (45.2%, a difference of 0.030%), and Japanese (45.2%, a difference of 0.040%).
| Demographics | Rating | Rank | Married-couple Households |
| Cubans | 7.7 /100 | #210 | Tragic 45.4% |
| Immigrants | Spain | 7.3 /100 | #211 | Tragic 45.3% |
| Creek | 6.4 /100 | #212 | Tragic 45.3% |
| Yakama | 5.8 /100 | #213 | Tragic 45.2% |
| Japanese | 5.7 /100 | #214 | Tragic 45.2% |
| Immigrants | Nepal | 5.6 /100 | #215 | Tragic 45.2% |
| Immigrants | Portugal | 5.6 /100 | #216 | Tragic 45.2% |
| Panamanians | 5.5 /100 | #217 | Tragic 45.2% |
| Immigrants | Azores | 5.3 /100 | #218 | Tragic 45.2% |
| Nicaraguans | 5.3 /100 | #219 | Tragic 45.2% |
| Immigrants | Thailand | 5.1 /100 | #220 | Tragic 45.2% |
| Tlingit-Haida | 4.9 /100 | #221 | Tragic 45.1% |
| Immigrants | Laos | 4.6 /100 | #222 | Tragic 45.1% |
| Immigrants | Cambodia | 2.7 /100 | #223 | Tragic 44.9% |
| Immigrants | Micronesia | 2.6 /100 | #224 | Tragic 44.9% |