Barbadian vs British Median Family Income
COMPARE
Barbadian
British
Median Family Income
Median Family Income Comparison
Barbadians
British
$93,919
MEDIAN FAMILY INCOME
1.1/ 100
METRIC RATING
242nd/ 347
METRIC RANK
$108,705
MEDIAN FAMILY INCOME
95.6/ 100
METRIC RATING
110th/ 347
METRIC RANK
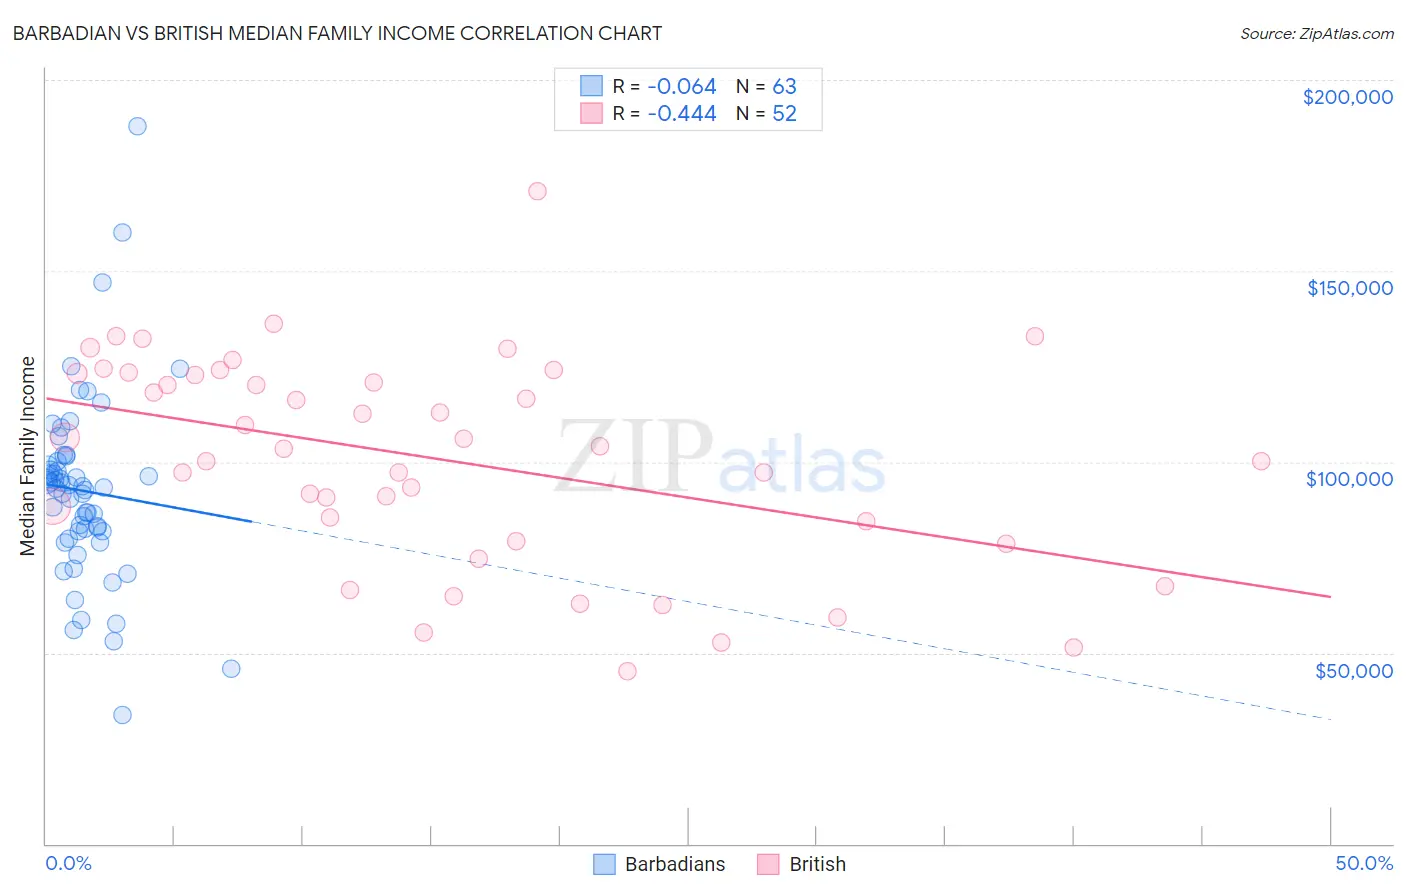
Barbadian vs British Median Family Income Correlation Chart
The statistical analysis conducted on geographies consisting of 141,221,123 people shows a slight negative correlation between the proportion of Barbadians and median family income in the United States with a correlation coefficient (R) of -0.064 and weighted average of $93,919. Similarly, the statistical analysis conducted on geographies consisting of 530,672,110 people shows a moderate negative correlation between the proportion of British and median family income in the United States with a correlation coefficient (R) of -0.444 and weighted average of $108,705, a difference of 15.7%.
Median Family Income Correlation Summary
| Measurement | Barbadian | British |
| Minimum | $33,750 | $45,060 |
| Maximum | $188,047 | $170,856 |
| Range | $154,297 | $125,796 |
| Mean | $92,437 | $100,714 |
| Median | $93,405 | $103,902 |
| Interquartile 25% (IQ1) | $81,674 | $81,768 |
| Interquartile 75% (IQ3) | $100,271 | $123,002 |
| Interquartile Range (IQR) | $18,597 | $41,234 |
| Standard Deviation (Sample) | $24,591 | $27,270 |
| Standard Deviation (Population) | $24,395 | $27,007 |
Similar Demographics by Median Family Income
Demographics Similar to Barbadians by Median Family Income
In terms of median family income, the demographic groups most similar to Barbadians are German Russian ($93,858, a difference of 0.060%), Immigrants from Trinidad and Tobago ($93,988, a difference of 0.070%), Somali ($94,085, a difference of 0.18%), Subsaharan African ($93,748, a difference of 0.18%), and Salvadoran ($94,109, a difference of 0.20%).
| Demographics | Rating | Rank | Median Family Income |
| Immigrants | Burma/Myanmar | 1.5 /100 | #235 | Tragic $94,472 |
| Trinidadians and Tobagonians | 1.5 /100 | #236 | Tragic $94,466 |
| Alaskan Athabascans | 1.5 /100 | #237 | Tragic $94,429 |
| Nepalese | 1.3 /100 | #238 | Tragic $94,153 |
| Salvadorans | 1.2 /100 | #239 | Tragic $94,109 |
| Somalis | 1.2 /100 | #240 | Tragic $94,085 |
| Immigrants | Trinidad and Tobago | 1.2 /100 | #241 | Tragic $93,988 |
| Barbadians | 1.1 /100 | #242 | Tragic $93,919 |
| German Russians | 1.1 /100 | #243 | Tragic $93,858 |
| Sub-Saharan Africans | 1.0 /100 | #244 | Tragic $93,748 |
| Immigrants | Middle Africa | 1.0 /100 | #245 | Tragic $93,593 |
| Guyanese | 0.9 /100 | #246 | Tragic $93,373 |
| Immigrants | Senegal | 0.7 /100 | #247 | Tragic $92,912 |
| French American Indians | 0.7 /100 | #248 | Tragic $92,872 |
| Immigrants | Ecuador | 0.7 /100 | #249 | Tragic $92,837 |
Demographics Similar to British by Median Family Income
In terms of median family income, the demographic groups most similar to British are Immigrants from Afghanistan ($108,709, a difference of 0.0%), Immigrants from Western Asia ($108,691, a difference of 0.010%), Immigrants from Zimbabwe ($108,830, a difference of 0.12%), Immigrants from Poland ($108,570, a difference of 0.12%), and Immigrants from Saudi Arabia ($108,544, a difference of 0.15%).
| Demographics | Rating | Rank | Median Family Income |
| Immigrants | Brazil | 96.9 /100 | #103 | Exceptional $109,418 |
| Palestinians | 96.9 /100 | #104 | Exceptional $109,413 |
| Syrians | 96.7 /100 | #105 | Exceptional $109,299 |
| Albanians | 96.4 /100 | #106 | Exceptional $109,136 |
| Immigrants | North Macedonia | 96.4 /100 | #107 | Exceptional $109,136 |
| Immigrants | Zimbabwe | 95.9 /100 | #108 | Exceptional $108,830 |
| Immigrants | Afghanistan | 95.6 /100 | #109 | Exceptional $108,709 |
| British | 95.6 /100 | #110 | Exceptional $108,705 |
| Immigrants | Western Asia | 95.6 /100 | #111 | Exceptional $108,691 |
| Immigrants | Poland | 95.3 /100 | #112 | Exceptional $108,570 |
| Immigrants | Saudi Arabia | 95.2 /100 | #113 | Exceptional $108,544 |
| Poles | 95.2 /100 | #114 | Exceptional $108,507 |
| Swedes | 95.1 /100 | #115 | Exceptional $108,499 |
| Chileans | 95.0 /100 | #116 | Exceptional $108,429 |
| Immigrants | Philippines | 94.6 /100 | #117 | Exceptional $108,288 |