Barbadian vs Russian Median Family Income
COMPARE
Barbadian
Russian
Median Family Income
Median Family Income Comparison
Barbadians
Russians
$93,919
MEDIAN FAMILY INCOME
1.1/ 100
METRIC RATING
242nd/ 347
METRIC RANK
$120,487
MEDIAN FAMILY INCOME
100.0/ 100
METRIC RATING
27th/ 347
METRIC RANK
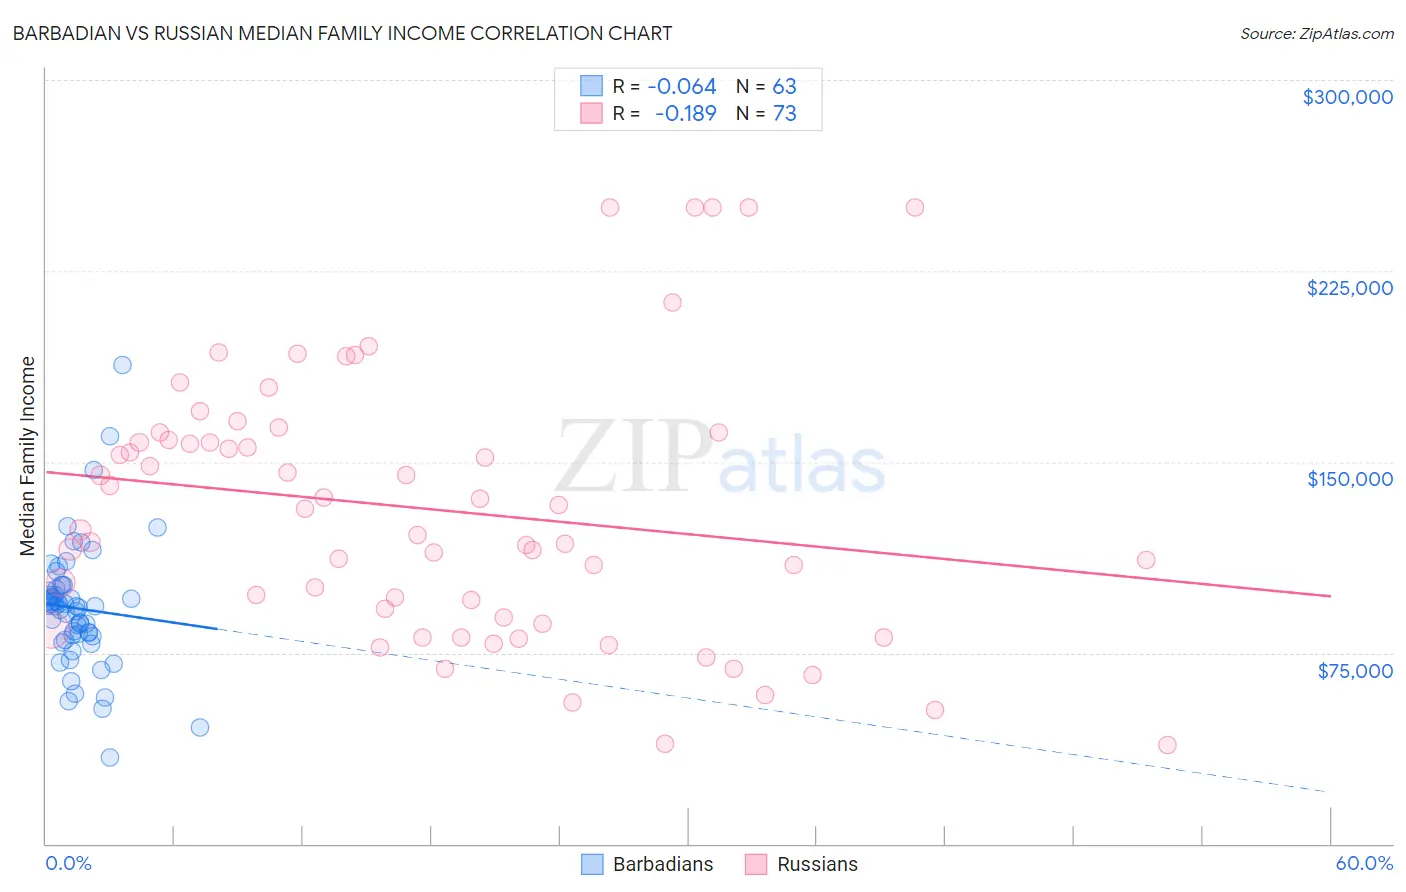
Barbadian vs Russian Median Family Income Correlation Chart
The statistical analysis conducted on geographies consisting of 141,221,123 people shows a slight negative correlation between the proportion of Barbadians and median family income in the United States with a correlation coefficient (R) of -0.064 and weighted average of $93,919. Similarly, the statistical analysis conducted on geographies consisting of 511,404,289 people shows a poor negative correlation between the proportion of Russians and median family income in the United States with a correlation coefficient (R) of -0.189 and weighted average of $120,487, a difference of 28.3%.
Median Family Income Correlation Summary
| Measurement | Barbadian | Russian |
| Minimum | $33,750 | $38,939 |
| Maximum | $188,047 | $250,001 |
| Range | $154,297 | $211,062 |
| Mean | $92,437 | $131,214 |
| Median | $93,405 | $123,457 |
| Interquartile 25% (IQ1) | $81,674 | $87,492 |
| Interquartile 75% (IQ3) | $100,271 | $160,004 |
| Interquartile Range (IQR) | $18,597 | $72,512 |
| Standard Deviation (Sample) | $24,591 | $52,364 |
| Standard Deviation (Population) | $24,395 | $52,005 |
Similar Demographics by Median Family Income
Demographics Similar to Barbadians by Median Family Income
In terms of median family income, the demographic groups most similar to Barbadians are German Russian ($93,858, a difference of 0.060%), Immigrants from Trinidad and Tobago ($93,988, a difference of 0.070%), Somali ($94,085, a difference of 0.18%), Subsaharan African ($93,748, a difference of 0.18%), and Salvadoran ($94,109, a difference of 0.20%).
| Demographics | Rating | Rank | Median Family Income |
| Immigrants | Burma/Myanmar | 1.5 /100 | #235 | Tragic $94,472 |
| Trinidadians and Tobagonians | 1.5 /100 | #236 | Tragic $94,466 |
| Alaskan Athabascans | 1.5 /100 | #237 | Tragic $94,429 |
| Nepalese | 1.3 /100 | #238 | Tragic $94,153 |
| Salvadorans | 1.2 /100 | #239 | Tragic $94,109 |
| Somalis | 1.2 /100 | #240 | Tragic $94,085 |
| Immigrants | Trinidad and Tobago | 1.2 /100 | #241 | Tragic $93,988 |
| Barbadians | 1.1 /100 | #242 | Tragic $93,919 |
| German Russians | 1.1 /100 | #243 | Tragic $93,858 |
| Sub-Saharan Africans | 1.0 /100 | #244 | Tragic $93,748 |
| Immigrants | Middle Africa | 1.0 /100 | #245 | Tragic $93,593 |
| Guyanese | 0.9 /100 | #246 | Tragic $93,373 |
| Immigrants | Senegal | 0.7 /100 | #247 | Tragic $92,912 |
| French American Indians | 0.7 /100 | #248 | Tragic $92,872 |
| Immigrants | Ecuador | 0.7 /100 | #249 | Tragic $92,837 |
Demographics Similar to Russians by Median Family Income
In terms of median family income, the demographic groups most similar to Russians are Immigrants from Denmark ($120,445, a difference of 0.040%), Latvian ($120,301, a difference of 0.15%), Immigrants from Sri Lanka ($120,263, a difference of 0.19%), Immigrants from Switzerland ($120,726, a difference of 0.20%), and Immigrants from France ($120,076, a difference of 0.34%).
| Demographics | Rating | Rank | Median Family Income |
| Burmese | 100.0 /100 | #20 | Exceptional $123,369 |
| Immigrants | Korea | 100.0 /100 | #21 | Exceptional $122,800 |
| Immigrants | Sweden | 100.0 /100 | #22 | Exceptional $122,765 |
| Immigrants | Japan | 100.0 /100 | #23 | Exceptional $122,764 |
| Immigrants | Northern Europe | 100.0 /100 | #24 | Exceptional $121,840 |
| Turks | 100.0 /100 | #25 | Exceptional $121,202 |
| Immigrants | Switzerland | 100.0 /100 | #26 | Exceptional $120,726 |
| Russians | 100.0 /100 | #27 | Exceptional $120,487 |
| Immigrants | Denmark | 100.0 /100 | #28 | Exceptional $120,445 |
| Latvians | 100.0 /100 | #29 | Exceptional $120,301 |
| Immigrants | Sri Lanka | 100.0 /100 | #30 | Exceptional $120,263 |
| Immigrants | France | 100.0 /100 | #31 | Exceptional $120,076 |
| Asians | 100.0 /100 | #32 | Exceptional $119,955 |
| Bhutanese | 100.0 /100 | #33 | Exceptional $119,800 |
| Bolivians | 100.0 /100 | #34 | Exceptional $119,479 |