Blackfeet vs Immigrants from North America Per Capita Income
COMPARE
Blackfeet
Immigrants from North America
Per Capita Income
Per Capita Income Comparison
Blackfeet
Immigrants from North America
$37,695
PER CAPITA INCOME
0.1/ 100
METRIC RATING
288th/ 347
METRIC RANK
$49,302
PER CAPITA INCOME
99.8/ 100
METRIC RATING
73rd/ 347
METRIC RANK
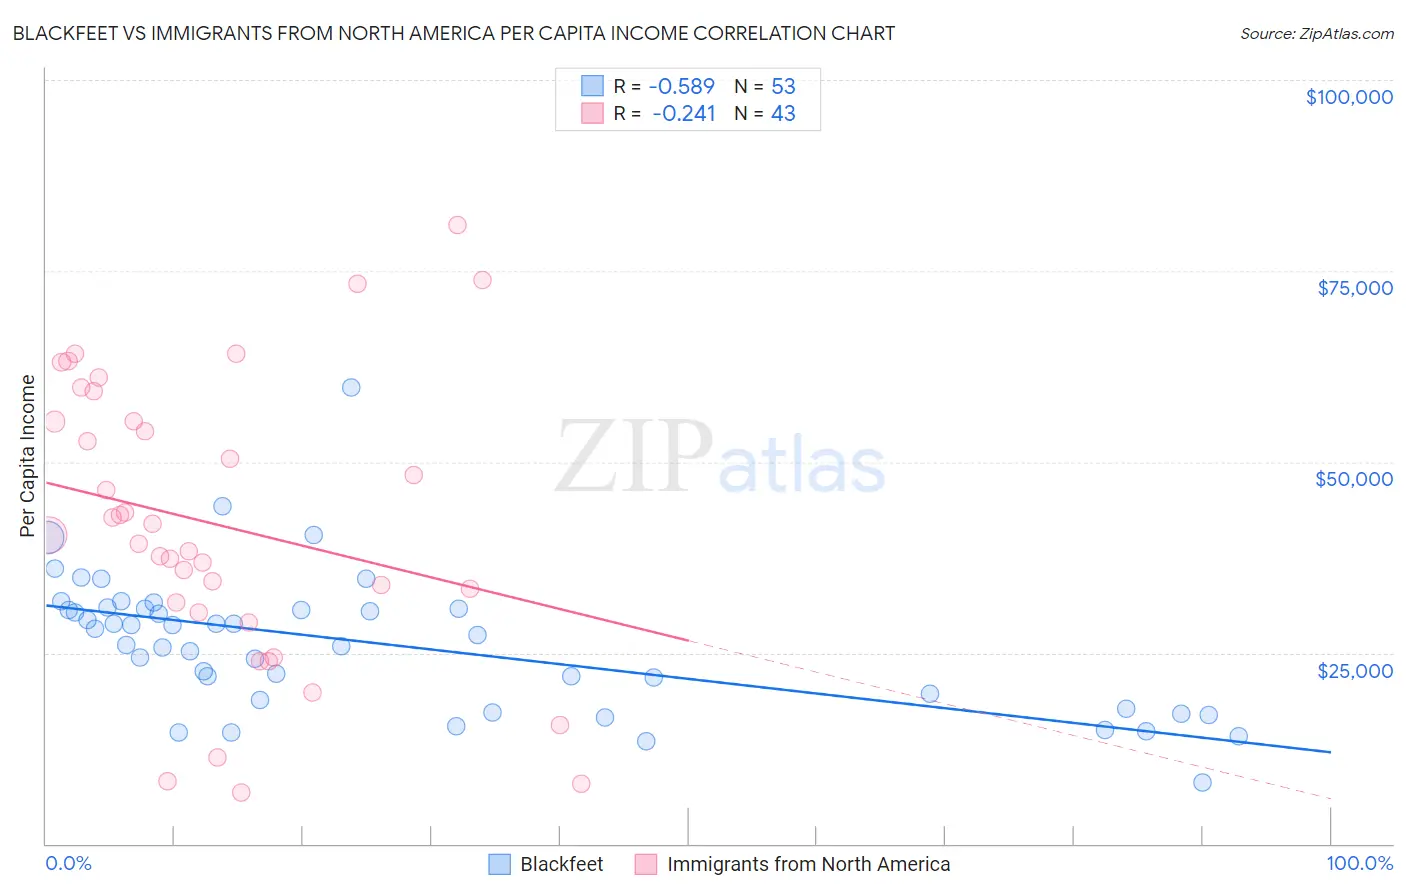
Blackfeet vs Immigrants from North America Per Capita Income Correlation Chart
The statistical analysis conducted on geographies consisting of 309,586,612 people shows a substantial negative correlation between the proportion of Blackfeet and per capita income in the United States with a correlation coefficient (R) of -0.589 and weighted average of $37,695. Similarly, the statistical analysis conducted on geographies consisting of 462,474,558 people shows a weak negative correlation between the proportion of Immigrants from North America and per capita income in the United States with a correlation coefficient (R) of -0.241 and weighted average of $49,302, a difference of 30.8%.
Per Capita Income Correlation Summary
| Measurement | Blackfeet | Immigrants from North America |
| Minimum | $7,946 | $6,700 |
| Maximum | $59,700 | $80,940 |
| Range | $51,754 | $74,240 |
| Mean | $26,182 | $41,767 |
| Median | $27,256 | $40,404 |
| Interquartile 25% (IQ1) | $18,286 | $30,302 |
| Interquartile 75% (IQ3) | $30,810 | $55,294 |
| Interquartile Range (IQR) | $12,524 | $24,991 |
| Standard Deviation (Sample) | $9,146 | $18,582 |
| Standard Deviation (Population) | $9,059 | $18,365 |
Similar Demographics by Per Capita Income
Demographics Similar to Blackfeet by Per Capita Income
In terms of per capita income, the demographic groups most similar to Blackfeet are Dominican ($37,697, a difference of 0.0%), Central American Indian ($37,699, a difference of 0.010%), Guatemalan ($37,766, a difference of 0.19%), African ($37,785, a difference of 0.24%), and U.S. Virgin Islander ($37,589, a difference of 0.28%).
| Demographics | Rating | Rank | Per Capita Income |
| Immigrants | Dominica | 0.2 /100 | #281 | Tragic $37,952 |
| Immigrants | Laos | 0.1 /100 | #282 | Tragic $37,857 |
| Pennsylvania Germans | 0.1 /100 | #283 | Tragic $37,842 |
| Africans | 0.1 /100 | #284 | Tragic $37,785 |
| Guatemalans | 0.1 /100 | #285 | Tragic $37,766 |
| Central American Indians | 0.1 /100 | #286 | Tragic $37,699 |
| Dominicans | 0.1 /100 | #287 | Tragic $37,697 |
| Blackfeet | 0.1 /100 | #288 | Tragic $37,695 |
| U.S. Virgin Islanders | 0.1 /100 | #289 | Tragic $37,589 |
| Immigrants | Guatemala | 0.1 /100 | #290 | Tragic $37,550 |
| Cajuns | 0.1 /100 | #291 | Tragic $37,527 |
| Immigrants | Micronesia | 0.1 /100 | #292 | Tragic $37,464 |
| Mexican American Indians | 0.1 /100 | #293 | Tragic $37,407 |
| Cubans | 0.1 /100 | #294 | Tragic $37,383 |
| Immigrants | Dominican Republic | 0.1 /100 | #295 | Tragic $37,306 |
Demographics Similar to Immigrants from North America by Per Capita Income
In terms of per capita income, the demographic groups most similar to Immigrants from North America are Immigrants from Hungary ($49,303, a difference of 0.0%), Greek ($49,309, a difference of 0.010%), Immigrants from Eastern Europe ($49,316, a difference of 0.030%), Immigrants from Canada ($49,412, a difference of 0.22%), and Mongolian ($49,173, a difference of 0.26%).
| Demographics | Rating | Rank | Per Capita Income |
| Immigrants | Bulgaria | 99.9 /100 | #66 | Exceptional $49,482 |
| Immigrants | Romania | 99.9 /100 | #67 | Exceptional $49,463 |
| Lithuanians | 99.8 /100 | #68 | Exceptional $49,448 |
| Immigrants | Canada | 99.8 /100 | #69 | Exceptional $49,412 |
| Immigrants | Eastern Europe | 99.8 /100 | #70 | Exceptional $49,316 |
| Greeks | 99.8 /100 | #71 | Exceptional $49,309 |
| Immigrants | Hungary | 99.8 /100 | #72 | Exceptional $49,303 |
| Immigrants | North America | 99.8 /100 | #73 | Exceptional $49,302 |
| Mongolians | 99.8 /100 | #74 | Exceptional $49,173 |
| Immigrants | Bolivia | 99.7 /100 | #75 | Exceptional $48,970 |
| Immigrants | England | 99.7 /100 | #76 | Exceptional $48,844 |
| Immigrants | Kazakhstan | 99.7 /100 | #77 | Exceptional $48,747 |
| Immigrants | Italy | 99.6 /100 | #78 | Exceptional $48,654 |
| Romanians | 99.5 /100 | #79 | Exceptional $48,445 |
| Egyptians | 99.5 /100 | #80 | Exceptional $48,358 |