Blackfeet vs Pueblo Per Capita Income
COMPARE
Blackfeet
Pueblo
Per Capita Income
Per Capita Income Comparison
Blackfeet
Pueblo
$37,695
PER CAPITA INCOME
0.1/ 100
METRIC RATING
288th/ 347
METRIC RANK
$32,012
PER CAPITA INCOME
0.0/ 100
METRIC RATING
339th/ 347
METRIC RANK
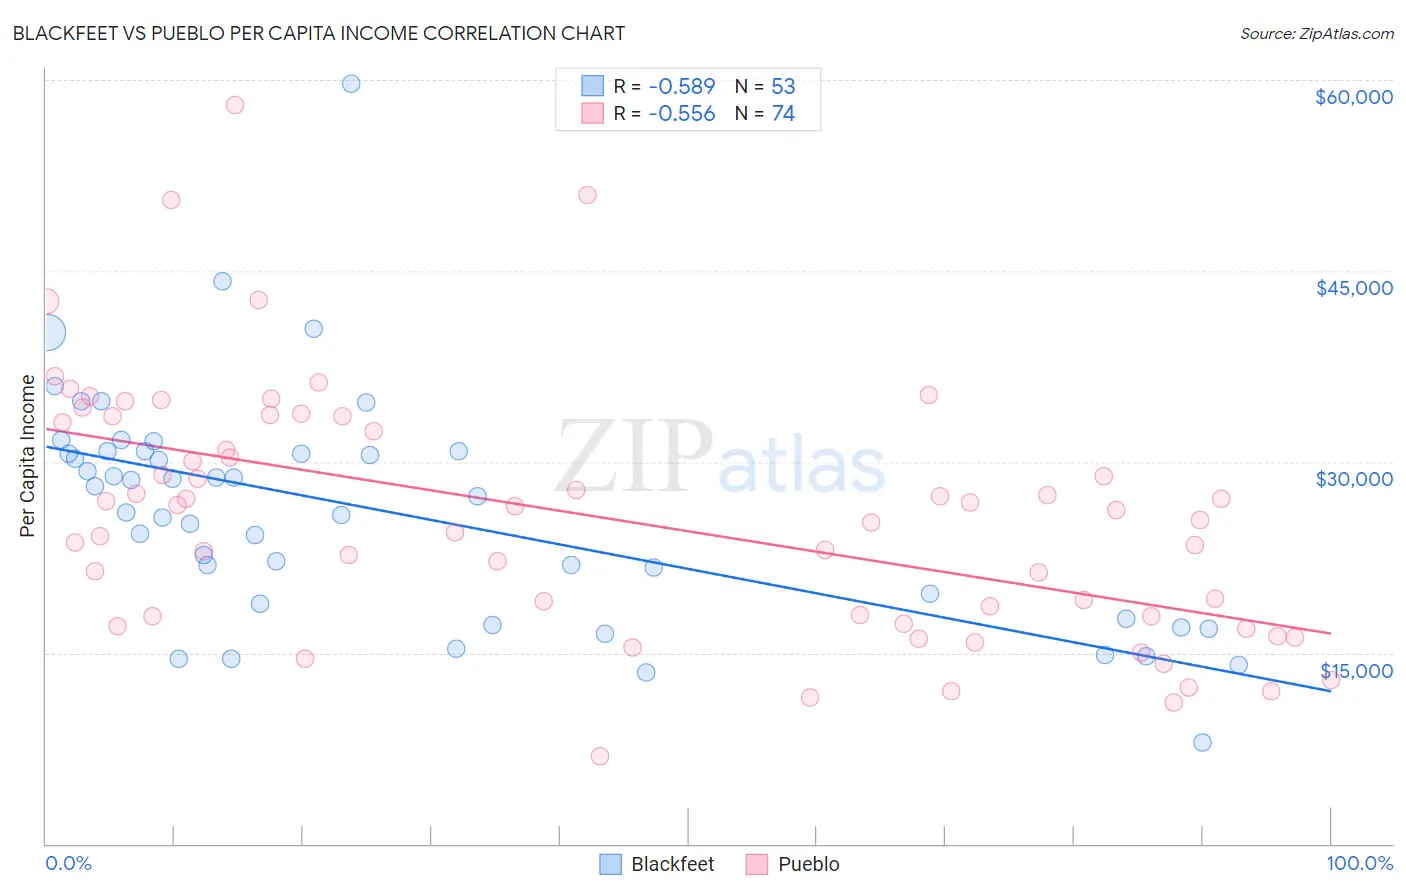
Blackfeet vs Pueblo Per Capita Income Correlation Chart
The statistical analysis conducted on geographies consisting of 309,586,612 people shows a substantial negative correlation between the proportion of Blackfeet and per capita income in the United States with a correlation coefficient (R) of -0.589 and weighted average of $37,695. Similarly, the statistical analysis conducted on geographies consisting of 120,085,924 people shows a substantial negative correlation between the proportion of Pueblo and per capita income in the United States with a correlation coefficient (R) of -0.556 and weighted average of $32,012, a difference of 17.7%.
Per Capita Income Correlation Summary
| Measurement | Blackfeet | Pueblo |
| Minimum | $7,946 | $6,914 |
| Maximum | $59,700 | $58,045 |
| Range | $51,754 | $51,131 |
| Mean | $26,182 | $25,689 |
| Median | $27,256 | $25,827 |
| Interquartile 25% (IQ1) | $18,286 | $17,826 |
| Interquartile 75% (IQ3) | $30,810 | $33,050 |
| Interquartile Range (IQR) | $12,524 | $15,224 |
| Standard Deviation (Sample) | $9,146 | $9,930 |
| Standard Deviation (Population) | $9,059 | $9,862 |
Similar Demographics by Per Capita Income
Demographics Similar to Blackfeet by Per Capita Income
In terms of per capita income, the demographic groups most similar to Blackfeet are Dominican ($37,697, a difference of 0.0%), Central American Indian ($37,699, a difference of 0.010%), Guatemalan ($37,766, a difference of 0.19%), African ($37,785, a difference of 0.24%), and U.S. Virgin Islander ($37,589, a difference of 0.28%).
| Demographics | Rating | Rank | Per Capita Income |
| Immigrants | Dominica | 0.2 /100 | #281 | Tragic $37,952 |
| Immigrants | Laos | 0.1 /100 | #282 | Tragic $37,857 |
| Pennsylvania Germans | 0.1 /100 | #283 | Tragic $37,842 |
| Africans | 0.1 /100 | #284 | Tragic $37,785 |
| Guatemalans | 0.1 /100 | #285 | Tragic $37,766 |
| Central American Indians | 0.1 /100 | #286 | Tragic $37,699 |
| Dominicans | 0.1 /100 | #287 | Tragic $37,697 |
| Blackfeet | 0.1 /100 | #288 | Tragic $37,695 |
| U.S. Virgin Islanders | 0.1 /100 | #289 | Tragic $37,589 |
| Immigrants | Guatemala | 0.1 /100 | #290 | Tragic $37,550 |
| Cajuns | 0.1 /100 | #291 | Tragic $37,527 |
| Immigrants | Micronesia | 0.1 /100 | #292 | Tragic $37,464 |
| Mexican American Indians | 0.1 /100 | #293 | Tragic $37,407 |
| Cubans | 0.1 /100 | #294 | Tragic $37,383 |
| Immigrants | Dominican Republic | 0.1 /100 | #295 | Tragic $37,306 |
Demographics Similar to Pueblo by Per Capita Income
In terms of per capita income, the demographic groups most similar to Pueblo are Crow ($31,729, a difference of 0.89%), Arapaho ($32,345, a difference of 1.0%), Puerto Rican ($31,268, a difference of 2.4%), Hopi ($31,177, a difference of 2.7%), and Houma ($32,996, a difference of 3.1%).
| Demographics | Rating | Rank | Per Capita Income |
| Sioux | 0.0 /100 | #332 | Tragic $33,921 |
| Immigrants | Yemen | 0.0 /100 | #333 | Tragic $33,696 |
| Natives/Alaskans | 0.0 /100 | #334 | Tragic $33,279 |
| Yuman | 0.0 /100 | #335 | Tragic $33,236 |
| Yakama | 0.0 /100 | #336 | Tragic $33,009 |
| Houma | 0.0 /100 | #337 | Tragic $32,996 |
| Arapaho | 0.0 /100 | #338 | Tragic $32,345 |
| Pueblo | 0.0 /100 | #339 | Tragic $32,012 |
| Crow | 0.0 /100 | #340 | Tragic $31,729 |
| Puerto Ricans | 0.0 /100 | #341 | Tragic $31,268 |
| Hopi | 0.0 /100 | #342 | Tragic $31,177 |
| Pima | 0.0 /100 | #343 | Tragic $30,644 |
| Yup'ik | 0.0 /100 | #344 | Tragic $30,518 |
| Tohono O'odham | 0.0 /100 | #345 | Tragic $30,256 |
| Lumbee | 0.0 /100 | #346 | Tragic $29,845 |