Icelander vs Kenyan Wage/Income Gap
COMPARE
Icelander
Kenyan
Wage/Income Gap
Wage/Income Gap Comparison
Icelanders
Kenyans
27.5%
WAGE/INCOME GAP
1.8/ 100
METRIC RATING
259th/ 347
METRIC RANK
24.5%
WAGE/INCOME GAP
95.8/ 100
METRIC RATING
119th/ 347
METRIC RANK
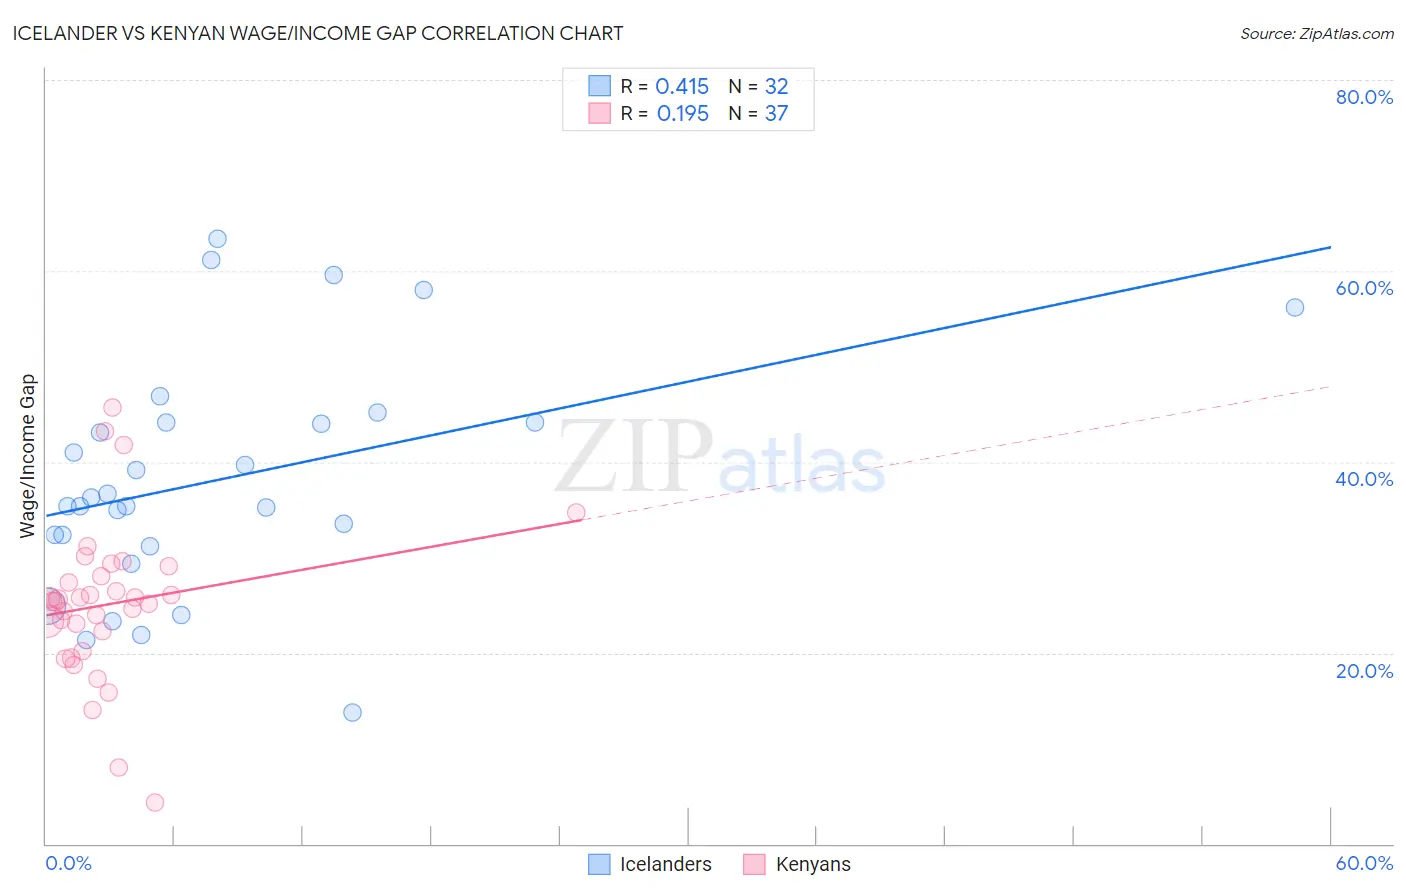
Icelander vs Kenyan Wage/Income Gap Correlation Chart
The statistical analysis conducted on geographies consisting of 159,627,714 people shows a moderate positive correlation between the proportion of Icelanders and wage/income gap percentage in the United States with a correlation coefficient (R) of 0.415 and weighted average of 27.5%. Similarly, the statistical analysis conducted on geographies consisting of 168,231,512 people shows a poor positive correlation between the proportion of Kenyans and wage/income gap percentage in the United States with a correlation coefficient (R) of 0.195 and weighted average of 24.5%, a difference of 12.3%.
Wage/Income Gap Correlation Summary
| Measurement | Icelander | Kenyan |
| Minimum | 13.8% | 4.3% |
| Maximum | 63.4% | 45.6% |
| Range | 49.6% | 41.3% |
| Mean | 38.2% | 25.1% |
| Median | 35.8% | 25.4% |
| Interquartile 25% (IQ1) | 31.7% | 21.2% |
| Interquartile 75% (IQ3) | 44.1% | 28.5% |
| Interquartile Range (IQR) | 12.4% | 7.3% |
| Standard Deviation (Sample) | 12.2% | 8.2% |
| Standard Deviation (Population) | 12.0% | 8.1% |
Similar Demographics by Wage/Income Gap
Demographics Similar to Icelanders by Wage/Income Gap
In terms of wage/income gap, the demographic groups most similar to Icelanders are Tongan (27.5%, a difference of 0.020%), Slavic (27.4%, a difference of 0.080%), Luxembourger (27.4%, a difference of 0.11%), Cherokee (27.4%, a difference of 0.16%), and Israeli (27.4%, a difference of 0.27%).
| Demographics | Rating | Rank | Wage/Income Gap |
| Ukrainians | 2.4 /100 | #252 | Tragic 27.3% |
| Portuguese | 2.2 /100 | #253 | Tragic 27.4% |
| Israelis | 2.1 /100 | #254 | Tragic 27.4% |
| Immigrants | France | 2.1 /100 | #255 | Tragic 27.4% |
| Cherokee | 1.9 /100 | #256 | Tragic 27.4% |
| Luxembourgers | 1.9 /100 | #257 | Tragic 27.4% |
| Slavs | 1.8 /100 | #258 | Tragic 27.4% |
| Icelanders | 1.8 /100 | #259 | Tragic 27.5% |
| Tongans | 1.7 /100 | #260 | Tragic 27.5% |
| Immigrants | Germany | 1.5 /100 | #261 | Tragic 27.5% |
| Immigrants | Lebanon | 1.5 /100 | #262 | Tragic 27.5% |
| Syrians | 1.4 /100 | #263 | Tragic 27.6% |
| Immigrants | Switzerland | 1.0 /100 | #264 | Tragic 27.7% |
| Serbians | 1.0 /100 | #265 | Tragic 27.7% |
| Hmong | 1.0 /100 | #266 | Tragic 27.7% |
Demographics Similar to Kenyans by Wage/Income Gap
In terms of wage/income gap, the demographic groups most similar to Kenyans are Immigrants from Micronesia (24.4%, a difference of 0.020%), Immigrants from Afghanistan (24.4%, a difference of 0.050%), Cree (24.5%, a difference of 0.070%), Alaska Native (24.4%, a difference of 0.11%), and Immigrants from Kenya (24.4%, a difference of 0.28%).
| Demographics | Rating | Rank | Wage/Income Gap |
| Immigrants | Colombia | 97.0 /100 | #112 | Exceptional 24.3% |
| Sioux | 96.9 /100 | #113 | Exceptional 24.3% |
| Panamanians | 96.5 /100 | #114 | Exceptional 24.4% |
| Immigrants | Kenya | 96.4 /100 | #115 | Exceptional 24.4% |
| Alaska Natives | 96.0 /100 | #116 | Exceptional 24.4% |
| Immigrants | Afghanistan | 95.9 /100 | #117 | Exceptional 24.4% |
| Immigrants | Micronesia | 95.8 /100 | #118 | Exceptional 24.4% |
| Kenyans | 95.8 /100 | #119 | Exceptional 24.5% |
| Cree | 95.6 /100 | #120 | Exceptional 24.5% |
| Immigrants | Thailand | 94.9 /100 | #121 | Exceptional 24.5% |
| Apache | 94.8 /100 | #122 | Exceptional 24.5% |
| Natives/Alaskans | 94.6 /100 | #123 | Exceptional 24.6% |
| Immigrants | South America | 93.9 /100 | #124 | Exceptional 24.6% |
| Spanish Americans | 93.8 /100 | #125 | Exceptional 24.6% |
| Immigrants | Uruguay | 93.8 /100 | #126 | Exceptional 24.6% |