Icelander vs Paraguayan Wage/Income Gap
COMPARE
Icelander
Paraguayan
Wage/Income Gap
Wage/Income Gap Comparison
Icelanders
Paraguayans
27.5%
WAGE/INCOME GAP
1.8/ 100
METRIC RATING
259th/ 347
METRIC RANK
25.8%
WAGE/INCOME GAP
46.7/ 100
METRIC RATING
176th/ 347
METRIC RANK
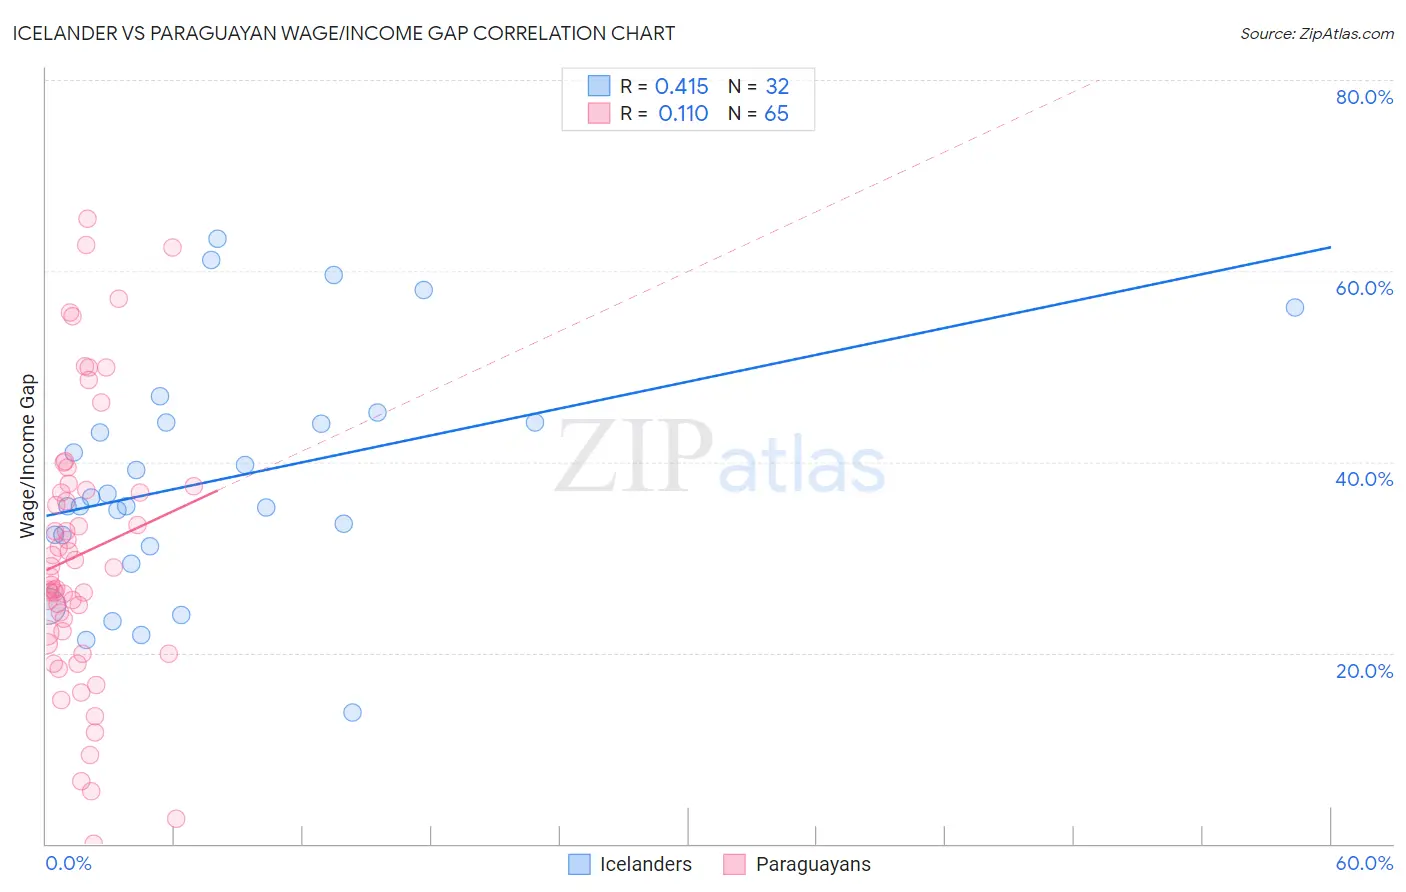
Icelander vs Paraguayan Wage/Income Gap Correlation Chart
The statistical analysis conducted on geographies consisting of 159,627,714 people shows a moderate positive correlation between the proportion of Icelanders and wage/income gap percentage in the United States with a correlation coefficient (R) of 0.415 and weighted average of 27.5%. Similarly, the statistical analysis conducted on geographies consisting of 95,100,210 people shows a poor positive correlation between the proportion of Paraguayans and wage/income gap percentage in the United States with a correlation coefficient (R) of 0.110 and weighted average of 25.8%, a difference of 6.3%.
Wage/Income Gap Correlation Summary
| Measurement | Icelander | Paraguayan |
| Minimum | 13.8% | 0.048% |
| Maximum | 63.4% | 65.5% |
| Range | 49.6% | 65.4% |
| Mean | 38.2% | 30.3% |
| Median | 35.8% | 28.0% |
| Interquartile 25% (IQ1) | 31.7% | 21.5% |
| Interquartile 75% (IQ3) | 44.1% | 37.3% |
| Interquartile Range (IQR) | 12.4% | 15.8% |
| Standard Deviation (Sample) | 12.2% | 14.5% |
| Standard Deviation (Population) | 12.0% | 14.3% |
Similar Demographics by Wage/Income Gap
Demographics Similar to Icelanders by Wage/Income Gap
In terms of wage/income gap, the demographic groups most similar to Icelanders are Tongan (27.5%, a difference of 0.020%), Slavic (27.4%, a difference of 0.080%), Luxembourger (27.4%, a difference of 0.11%), Cherokee (27.4%, a difference of 0.16%), and Israeli (27.4%, a difference of 0.27%).
| Demographics | Rating | Rank | Wage/Income Gap |
| Ukrainians | 2.4 /100 | #252 | Tragic 27.3% |
| Portuguese | 2.2 /100 | #253 | Tragic 27.4% |
| Israelis | 2.1 /100 | #254 | Tragic 27.4% |
| Immigrants | France | 2.1 /100 | #255 | Tragic 27.4% |
| Cherokee | 1.9 /100 | #256 | Tragic 27.4% |
| Luxembourgers | 1.9 /100 | #257 | Tragic 27.4% |
| Slavs | 1.8 /100 | #258 | Tragic 27.4% |
| Icelanders | 1.8 /100 | #259 | Tragic 27.5% |
| Tongans | 1.7 /100 | #260 | Tragic 27.5% |
| Immigrants | Germany | 1.5 /100 | #261 | Tragic 27.5% |
| Immigrants | Lebanon | 1.5 /100 | #262 | Tragic 27.5% |
| Syrians | 1.4 /100 | #263 | Tragic 27.6% |
| Immigrants | Switzerland | 1.0 /100 | #264 | Tragic 27.7% |
| Serbians | 1.0 /100 | #265 | Tragic 27.7% |
| Hmong | 1.0 /100 | #266 | Tragic 27.7% |
Demographics Similar to Paraguayans by Wage/Income Gap
In terms of wage/income gap, the demographic groups most similar to Paraguayans are Sri Lankan (25.8%, a difference of 0.020%), Cambodian (25.8%, a difference of 0.11%), Alaskan Athabascan (25.8%, a difference of 0.21%), Chinese (25.9%, a difference of 0.32%), and Immigrants from Belarus (25.7%, a difference of 0.41%).
| Demographics | Rating | Rank | Wage/Income Gap |
| Peruvians | 60.1 /100 | #169 | Good 25.6% |
| Immigrants | Oceania | 57.5 /100 | #170 | Average 25.6% |
| Immigrants | Greece | 56.6 /100 | #171 | Average 25.7% |
| Immigrants | Chile | 53.2 /100 | #172 | Average 25.7% |
| Immigrants | Belarus | 52.9 /100 | #173 | Average 25.7% |
| Alaskan Athabascans | 50.0 /100 | #174 | Average 25.8% |
| Sri Lankans | 47.0 /100 | #175 | Average 25.8% |
| Paraguayans | 46.7 /100 | #176 | Average 25.8% |
| Cambodians | 45.1 /100 | #177 | Average 25.8% |
| Chinese | 42.0 /100 | #178 | Average 25.9% |
| Samoans | 38.6 /100 | #179 | Fair 26.0% |
| Guamanians/Chamorros | 38.0 /100 | #180 | Fair 26.0% |
| Immigrants | Bolivia | 36.4 /100 | #181 | Fair 26.0% |
| Immigrants | Serbia | 35.4 /100 | #182 | Fair 26.0% |
| Immigrants | Kazakhstan | 35.2 /100 | #183 | Fair 26.0% |