Immigrants from Bahamas vs Uruguayan Householder Income Ages 45 - 64 years
COMPARE
Immigrants from Bahamas
Uruguayan
Householder Income Ages 45 - 64 years
Householder Income Ages 45 - 64 years Comparison
Immigrants from Bahamas
Uruguayans
$83,177
HOUSEHOLDER INCOME AGES 45 - 64 YEARS
0.0/ 100
METRIC RATING
311th/ 347
METRIC RANK
$98,660
HOUSEHOLDER INCOME AGES 45 - 64 YEARS
30.3/ 100
METRIC RATING
194th/ 347
METRIC RANK
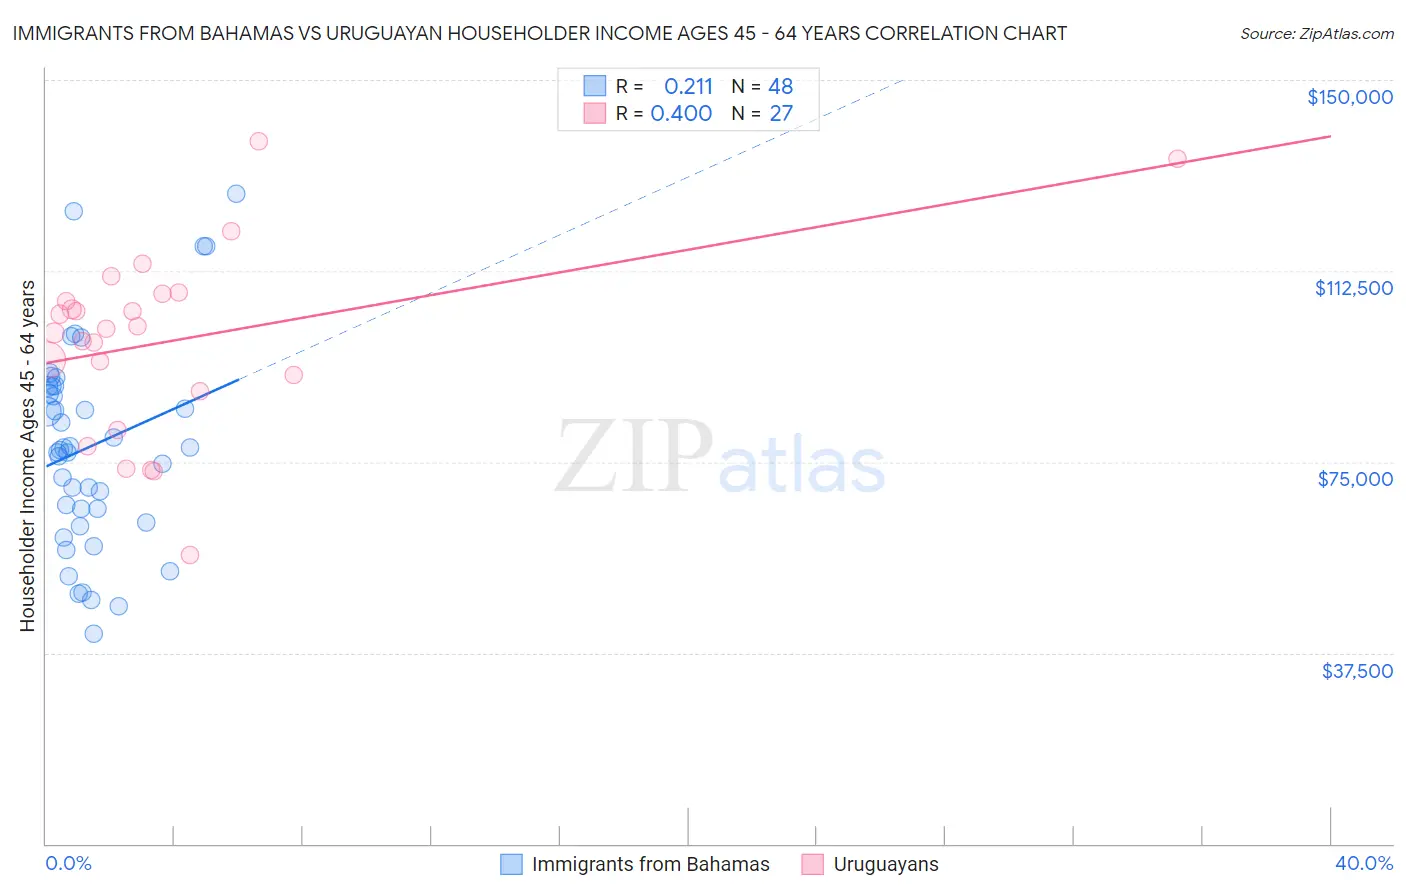
Immigrants from Bahamas vs Uruguayan Householder Income Ages 45 - 64 years Correlation Chart
The statistical analysis conducted on geographies consisting of 104,531,402 people shows a weak positive correlation between the proportion of Immigrants from Bahamas and household income with householder between the ages 45 and 64 in the United States with a correlation coefficient (R) of 0.211 and weighted average of $83,177. Similarly, the statistical analysis conducted on geographies consisting of 144,714,251 people shows a moderate positive correlation between the proportion of Uruguayans and household income with householder between the ages 45 and 64 in the United States with a correlation coefficient (R) of 0.400 and weighted average of $98,660, a difference of 18.6%.
Householder Income Ages 45 - 64 years Correlation Summary
| Measurement | Immigrants from Bahamas | Uruguayan |
| Minimum | $41,195 | $56,731 |
| Maximum | $127,688 | $137,932 |
| Range | $86,493 | $81,201 |
| Mean | $78,060 | $98,728 |
| Median | $77,570 | $101,066 |
| Interquartile 25% (IQ1) | $64,406 | $88,750 |
| Interquartile 75% (IQ3) | $89,869 | $107,917 |
| Interquartile Range (IQR) | $25,463 | $19,167 |
| Standard Deviation (Sample) | $20,104 | $18,259 |
| Standard Deviation (Population) | $19,893 | $17,917 |
Similar Demographics by Householder Income Ages 45 - 64 years
Demographics Similar to Immigrants from Bahamas by Householder Income Ages 45 - 64 years
In terms of householder income ages 45 - 64 years, the demographic groups most similar to Immigrants from Bahamas are Immigrants from Haiti ($83,257, a difference of 0.10%), Immigrants from Dominica ($83,311, a difference of 0.16%), Cajun ($83,015, a difference of 0.20%), Immigrants from Cabo Verde ($83,542, a difference of 0.44%), and Shoshone ($83,588, a difference of 0.49%).
| Demographics | Rating | Rank | Householder Income Ages 45 - 64 years |
| Ottawa | 0.0 /100 | #304 | Tragic $83,953 |
| Chippewa | 0.0 /100 | #305 | Tragic $83,943 |
| Ute | 0.0 /100 | #306 | Tragic $83,937 |
| Shoshone | 0.0 /100 | #307 | Tragic $83,588 |
| Immigrants | Cabo Verde | 0.0 /100 | #308 | Tragic $83,542 |
| Immigrants | Dominica | 0.0 /100 | #309 | Tragic $83,311 |
| Immigrants | Haiti | 0.0 /100 | #310 | Tragic $83,257 |
| Immigrants | Bahamas | 0.0 /100 | #311 | Tragic $83,177 |
| Cajuns | 0.0 /100 | #312 | Tragic $83,015 |
| U.S. Virgin Islanders | 0.0 /100 | #313 | Tragic $82,736 |
| Immigrants | Honduras | 0.0 /100 | #314 | Tragic $82,697 |
| Paiute | 0.0 /100 | #315 | Tragic $82,629 |
| Immigrants | Caribbean | 0.0 /100 | #316 | Tragic $82,513 |
| Colville | 0.0 /100 | #317 | Tragic $82,474 |
| Choctaw | 0.0 /100 | #318 | Tragic $82,287 |
Demographics Similar to Uruguayans by Householder Income Ages 45 - 64 years
In terms of householder income ages 45 - 64 years, the demographic groups most similar to Uruguayans are Spanish ($98,554, a difference of 0.11%), Hawaiian ($98,778, a difference of 0.12%), Immigrants from Eastern Africa ($98,467, a difference of 0.20%), Celtic ($98,896, a difference of 0.24%), and Kenyan ($98,970, a difference of 0.31%).
| Demographics | Rating | Rank | Householder Income Ages 45 - 64 years |
| Iraqis | 38.5 /100 | #187 | Fair $99,387 |
| Immigrants | Portugal | 36.3 /100 | #188 | Fair $99,203 |
| Immigrants | South America | 35.4 /100 | #189 | Fair $99,126 |
| French Canadians | 35.1 /100 | #190 | Fair $99,093 |
| Kenyans | 33.7 /100 | #191 | Fair $98,970 |
| Celtics | 32.9 /100 | #192 | Fair $98,896 |
| Hawaiians | 31.6 /100 | #193 | Fair $98,778 |
| Uruguayans | 30.3 /100 | #194 | Fair $98,660 |
| Spanish | 29.2 /100 | #195 | Fair $98,554 |
| Immigrants | Eastern Africa | 28.3 /100 | #196 | Fair $98,467 |
| Puget Sound Salish | 27.0 /100 | #197 | Fair $98,340 |
| Immigrants | Iraq | 25.7 /100 | #198 | Fair $98,201 |
| Whites/Caucasians | 24.6 /100 | #199 | Fair $98,091 |
| Immigrants | Kenya | 23.5 /100 | #200 | Fair $97,964 |
| Yugoslavians | 20.0 /100 | #201 | Fair $97,558 |