Moroccan vs Uruguayan Householder Income Ages 45 - 64 years
COMPARE
Moroccan
Uruguayan
Householder Income Ages 45 - 64 years
Householder Income Ages 45 - 64 years Comparison
Moroccans
Uruguayans
$100,138
HOUSEHOLDER INCOME AGES 45 - 64 YEARS
47.7/ 100
METRIC RATING
177th/ 347
METRIC RANK
$98,660
HOUSEHOLDER INCOME AGES 45 - 64 YEARS
30.3/ 100
METRIC RATING
194th/ 347
METRIC RANK
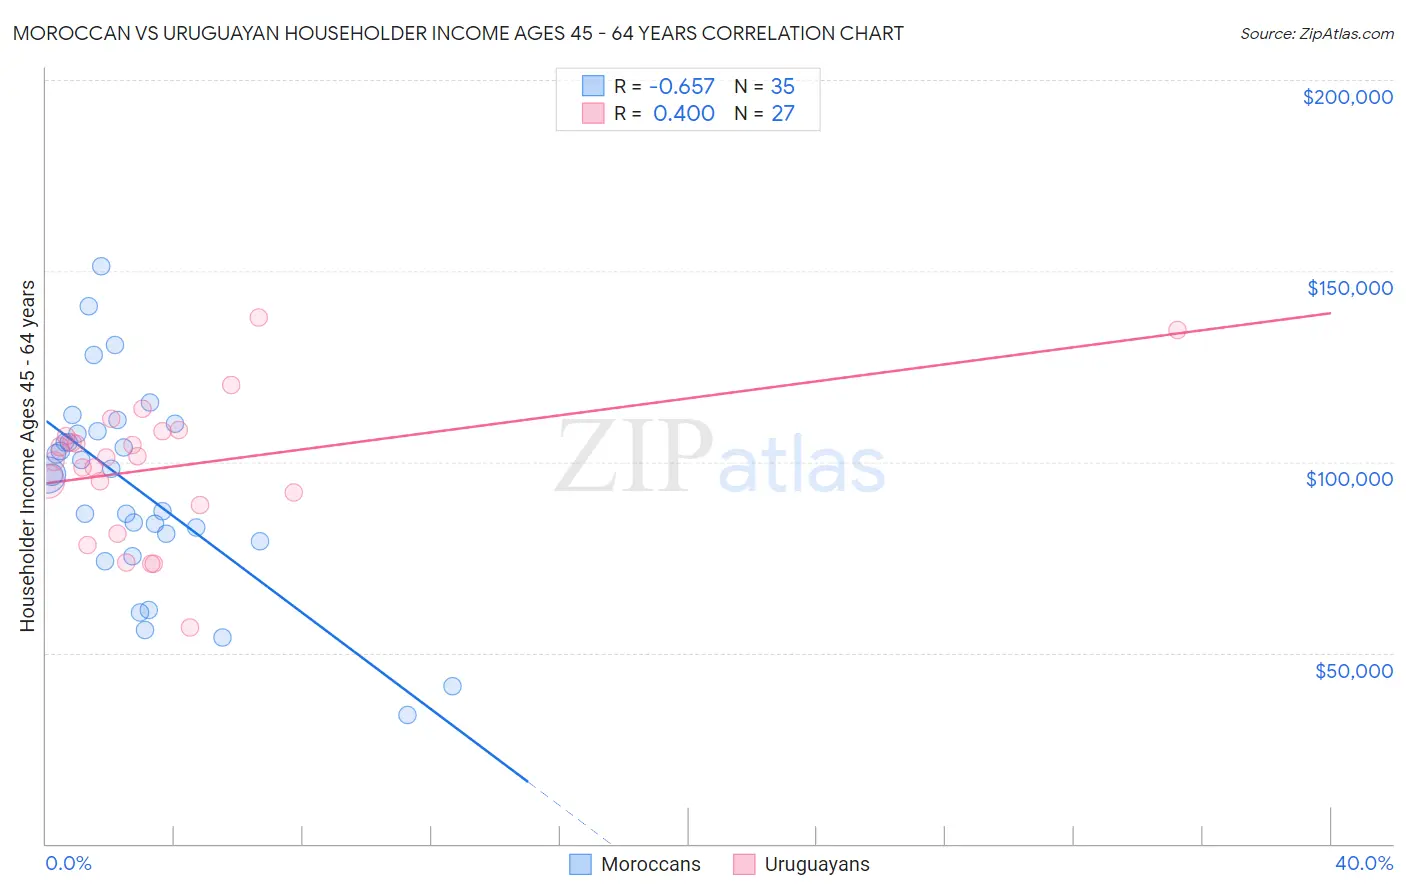
Moroccan vs Uruguayan Householder Income Ages 45 - 64 years Correlation Chart
The statistical analysis conducted on geographies consisting of 201,649,728 people shows a significant negative correlation between the proportion of Moroccans and household income with householder between the ages 45 and 64 in the United States with a correlation coefficient (R) of -0.657 and weighted average of $100,138. Similarly, the statistical analysis conducted on geographies consisting of 144,714,251 people shows a moderate positive correlation between the proportion of Uruguayans and household income with householder between the ages 45 and 64 in the United States with a correlation coefficient (R) of 0.400 and weighted average of $98,660, a difference of 1.5%.
Householder Income Ages 45 - 64 years Correlation Summary
| Measurement | Moroccan | Uruguayan |
| Minimum | $33,750 | $56,731 |
| Maximum | $151,275 | $137,932 |
| Range | $117,525 | $81,201 |
| Mean | $92,917 | $98,728 |
| Median | $96,708 | $101,066 |
| Interquartile 25% (IQ1) | $79,167 | $88,750 |
| Interquartile 75% (IQ3) | $108,085 | $107,917 |
| Interquartile Range (IQR) | $28,918 | $19,167 |
| Standard Deviation (Sample) | $26,273 | $18,259 |
| Standard Deviation (Population) | $25,895 | $17,917 |
Demographics Similar to Moroccans and Uruguayans by Householder Income Ages 45 - 64 years
In terms of householder income ages 45 - 64 years, the demographic groups most similar to Moroccans are Immigrants from Costa Rica ($100,141, a difference of 0.0%), Immigrants from Cameroon ($100,084, a difference of 0.050%), Belgian ($100,060, a difference of 0.080%), German ($100,224, a difference of 0.090%), and Aleut ($100,052, a difference of 0.090%). Similarly, the demographic groups most similar to Uruguayans are Spanish ($98,554, a difference of 0.11%), Hawaiian ($98,778, a difference of 0.12%), Celtic ($98,896, a difference of 0.24%), Kenyan ($98,970, a difference of 0.31%), and French Canadian ($99,093, a difference of 0.44%).
| Demographics | Rating | Rank | Householder Income Ages 45 - 64 years |
| Germans | 48.8 /100 | #175 | Average $100,224 |
| Immigrants | Costa Rica | 47.7 /100 | #176 | Average $100,141 |
| Moroccans | 47.7 /100 | #177 | Average $100,138 |
| Immigrants | Cameroon | 47.0 /100 | #178 | Average $100,084 |
| Belgians | 46.7 /100 | #179 | Average $100,060 |
| Aleuts | 46.6 /100 | #180 | Average $100,052 |
| Immigrants | Immigrants | 45.3 /100 | #181 | Average $99,943 |
| Finns | 44.8 /100 | #182 | Average $99,904 |
| Spaniards | 44.6 /100 | #183 | Average $99,889 |
| French | 43.8 /100 | #184 | Average $99,824 |
| Colombians | 43.2 /100 | #185 | Average $99,772 |
| Dutch | 41.7 /100 | #186 | Average $99,650 |
| Iraqis | 38.5 /100 | #187 | Fair $99,387 |
| Immigrants | Portugal | 36.3 /100 | #188 | Fair $99,203 |
| Immigrants | South America | 35.4 /100 | #189 | Fair $99,126 |
| French Canadians | 35.1 /100 | #190 | Fair $99,093 |
| Kenyans | 33.7 /100 | #191 | Fair $98,970 |
| Celtics | 32.9 /100 | #192 | Fair $98,896 |
| Hawaiians | 31.6 /100 | #193 | Fair $98,778 |
| Uruguayans | 30.3 /100 | #194 | Fair $98,660 |
| Spanish | 29.2 /100 | #195 | Fair $98,554 |