Immigrants from Netherlands vs Israeli Householder Income Ages 25 - 44 years
COMPARE
Immigrants from Netherlands
Israeli
Householder Income Ages 25 - 44 years
Householder Income Ages 25 - 44 years Comparison
Immigrants from Netherlands
Israelis
$105,082
HOUSEHOLDER INCOME AGES 25 - 44 YEARS
99.7/ 100
METRIC RATING
65th/ 347
METRIC RANK
$107,579
HOUSEHOLDER INCOME AGES 25 - 44 YEARS
99.9/ 100
METRIC RATING
45th/ 347
METRIC RANK
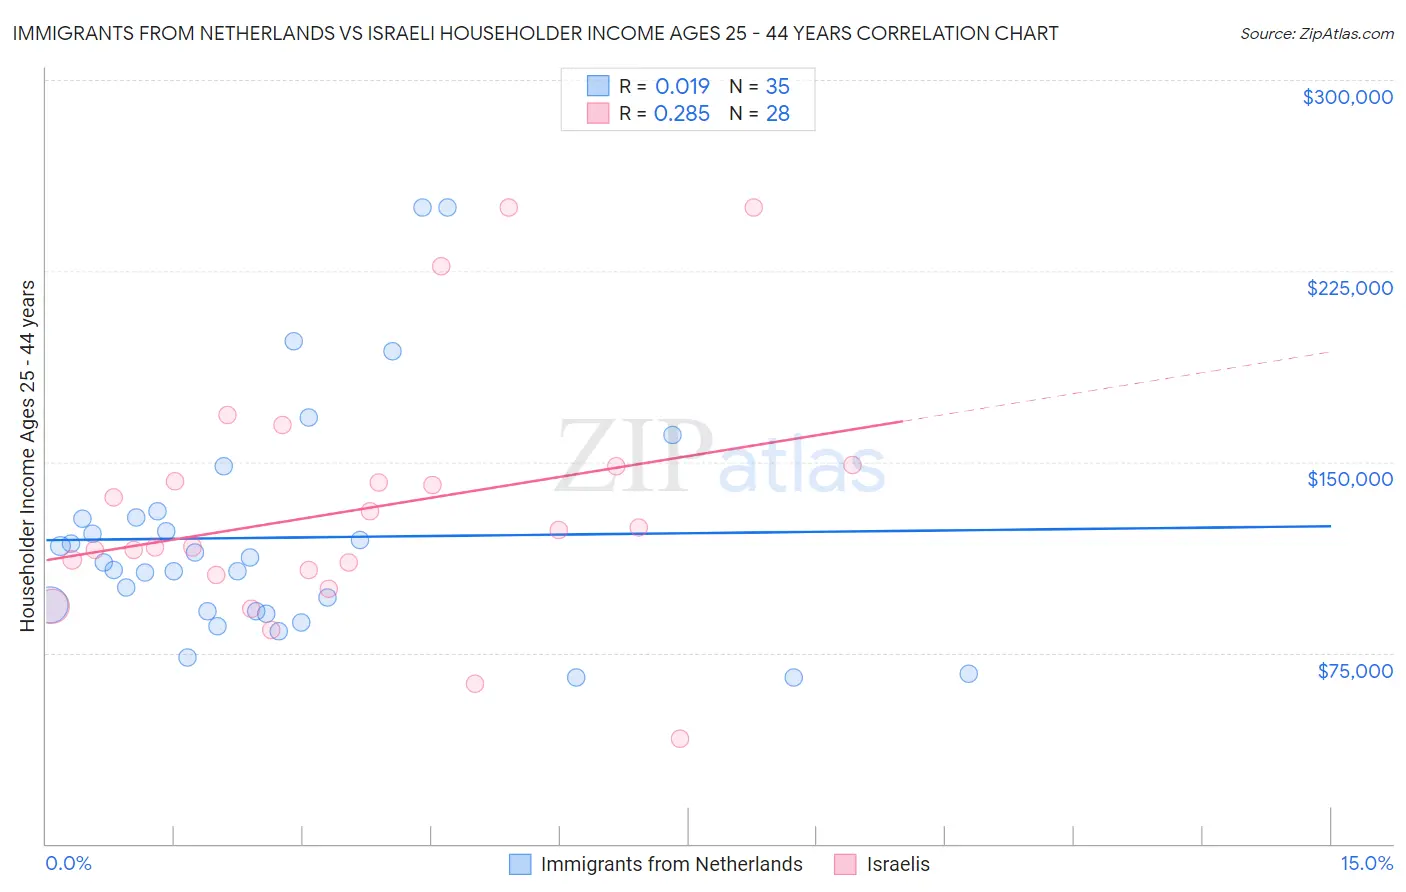
Immigrants from Netherlands vs Israeli Householder Income Ages 25 - 44 years Correlation Chart
The statistical analysis conducted on geographies consisting of 237,314,121 people shows no correlation between the proportion of Immigrants from Netherlands and household income with householder between the ages 25 and 44 in the United States with a correlation coefficient (R) of 0.019 and weighted average of $105,082. Similarly, the statistical analysis conducted on geographies consisting of 210,632,541 people shows a weak positive correlation between the proportion of Israelis and household income with householder between the ages 25 and 44 in the United States with a correlation coefficient (R) of 0.285 and weighted average of $107,579, a difference of 2.4%.
Householder Income Ages 25 - 44 years Correlation Summary
| Measurement | Immigrants from Netherlands | Israeli |
| Minimum | $65,500 | $41,080 |
| Maximum | $250,001 | $250,001 |
| Range | $184,501 | $208,921 |
| Mean | $120,241 | $131,021 |
| Median | $110,291 | $119,912 |
| Interquartile 25% (IQ1) | $91,522 | $106,515 |
| Interquartile 75% (IQ3) | $128,108 | $145,332 |
| Interquartile Range (IQR) | $36,587 | $38,818 |
| Standard Deviation (Sample) | $45,284 | $48,252 |
| Standard Deviation (Population) | $44,632 | $47,383 |
Demographics Similar to Immigrants from Netherlands and Israelis by Householder Income Ages 25 - 44 years
In terms of householder income ages 25 - 44 years, the demographic groups most similar to Immigrants from Netherlands are New Zealander ($105,085, a difference of 0.0%), Immigrants from Scotland ($105,089, a difference of 0.010%), Immigrants from Italy ($105,201, a difference of 0.11%), Lithuanian ($105,223, a difference of 0.13%), and Egyptian ($105,282, a difference of 0.19%). Similarly, the demographic groups most similar to Israelis are Immigrants from Belarus ($107,393, a difference of 0.17%), Estonian ($107,269, a difference of 0.29%), Bulgarian ($107,264, a difference of 0.29%), Immigrants from Turkey ($107,258, a difference of 0.30%), and Cambodian ($107,148, a difference of 0.40%).
| Demographics | Rating | Rank | Householder Income Ages 25 - 44 years |
| Israelis | 99.9 /100 | #45 | Exceptional $107,579 |
| Immigrants | Belarus | 99.9 /100 | #46 | Exceptional $107,393 |
| Estonians | 99.9 /100 | #47 | Exceptional $107,269 |
| Bulgarians | 99.9 /100 | #48 | Exceptional $107,264 |
| Immigrants | Turkey | 99.9 /100 | #49 | Exceptional $107,258 |
| Cambodians | 99.9 /100 | #50 | Exceptional $107,148 |
| Immigrants | Czechoslovakia | 99.9 /100 | #51 | Exceptional $106,888 |
| Immigrants | Europe | 99.9 /100 | #52 | Exceptional $106,817 |
| Immigrants | Norway | 99.9 /100 | #53 | Exceptional $106,629 |
| Paraguayans | 99.9 /100 | #54 | Exceptional $106,615 |
| Greeks | 99.9 /100 | #55 | Exceptional $106,457 |
| Immigrants | Pakistan | 99.8 /100 | #56 | Exceptional $106,129 |
| Immigrants | Austria | 99.8 /100 | #57 | Exceptional $106,103 |
| Immigrants | South Africa | 99.8 /100 | #58 | Exceptional $105,748 |
| Immigrants | Latvia | 99.8 /100 | #59 | Exceptional $105,522 |
| Egyptians | 99.7 /100 | #60 | Exceptional $105,282 |
| Lithuanians | 99.7 /100 | #61 | Exceptional $105,223 |
| Immigrants | Italy | 99.7 /100 | #62 | Exceptional $105,201 |
| Immigrants | Scotland | 99.7 /100 | #63 | Exceptional $105,089 |
| New Zealanders | 99.7 /100 | #64 | Exceptional $105,085 |
| Immigrants | Netherlands | 99.7 /100 | #65 | Exceptional $105,082 |