Yaqui vs Israeli Householder Income Ages 25 - 44 years
COMPARE
Yaqui
Israeli
Householder Income Ages 25 - 44 years
Householder Income Ages 25 - 44 years Comparison
Yaqui
Israelis
$81,656
HOUSEHOLDER INCOME AGES 25 - 44 YEARS
0.1/ 100
METRIC RATING
292nd/ 347
METRIC RANK
$107,579
HOUSEHOLDER INCOME AGES 25 - 44 YEARS
99.9/ 100
METRIC RATING
45th/ 347
METRIC RANK
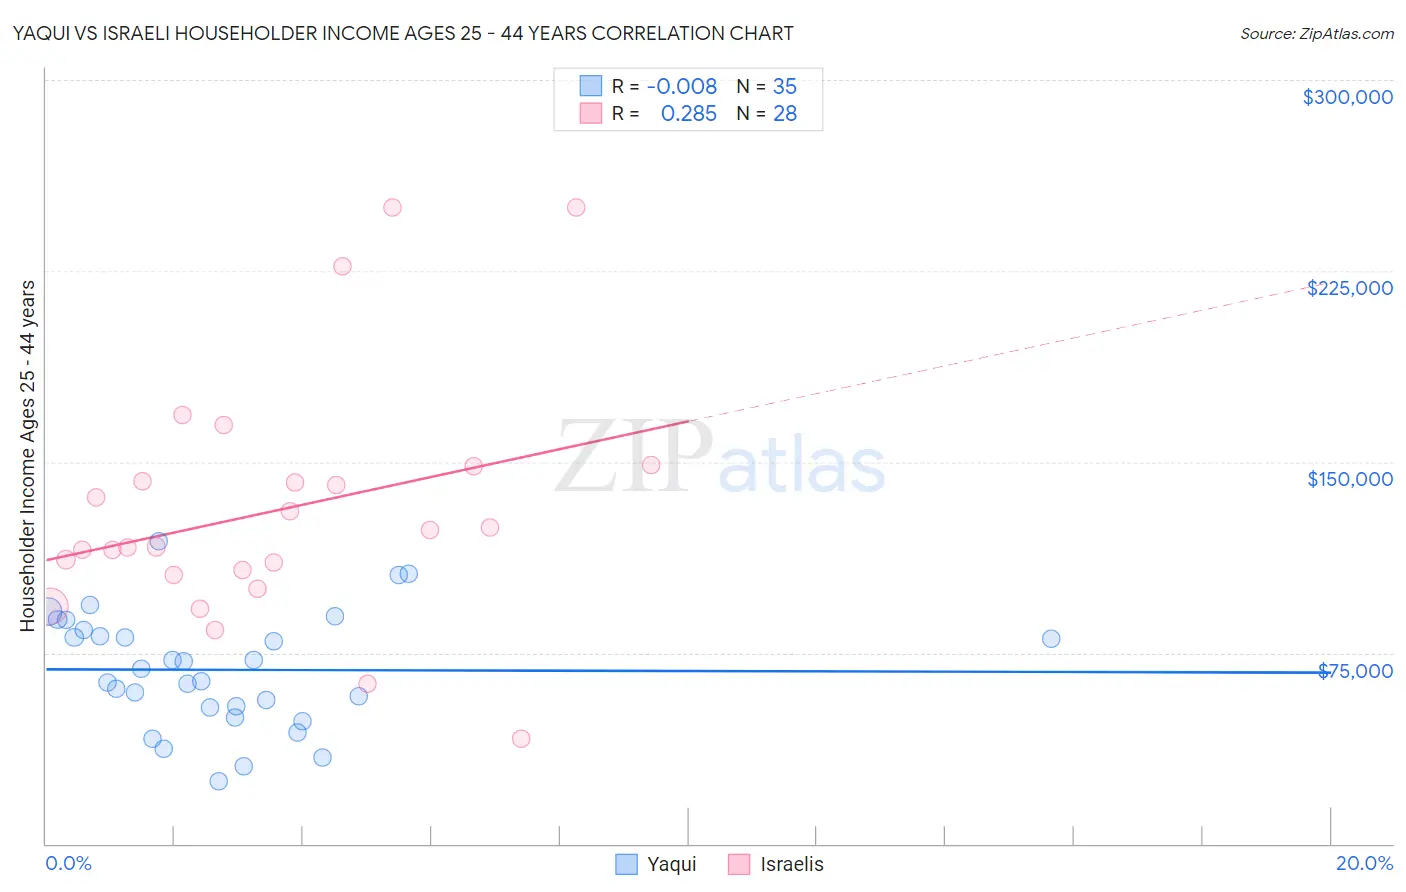
Yaqui vs Israeli Householder Income Ages 25 - 44 years Correlation Chart
The statistical analysis conducted on geographies consisting of 107,629,543 people shows no correlation between the proportion of Yaqui and household income with householder between the ages 25 and 44 in the United States with a correlation coefficient (R) of -0.008 and weighted average of $81,656. Similarly, the statistical analysis conducted on geographies consisting of 210,632,541 people shows a weak positive correlation between the proportion of Israelis and household income with householder between the ages 25 and 44 in the United States with a correlation coefficient (R) of 0.285 and weighted average of $107,579, a difference of 31.8%.
Householder Income Ages 25 - 44 years Correlation Summary
| Measurement | Yaqui | Israeli |
| Minimum | $24,313 | $41,080 |
| Maximum | $118,928 | $250,001 |
| Range | $94,615 | $208,921 |
| Mean | $68,343 | $131,021 |
| Median | $68,776 | $119,912 |
| Interquartile 25% (IQ1) | $53,438 | $106,515 |
| Interquartile 75% (IQ3) | $83,858 | $145,332 |
| Interquartile Range (IQR) | $30,420 | $38,818 |
| Standard Deviation (Sample) | $22,560 | $48,252 |
| Standard Deviation (Population) | $22,236 | $47,383 |
Similar Demographics by Householder Income Ages 25 - 44 years
Demographics Similar to Yaqui by Householder Income Ages 25 - 44 years
In terms of householder income ages 25 - 44 years, the demographic groups most similar to Yaqui are Potawatomi ($81,774, a difference of 0.14%), Blackfeet ($81,531, a difference of 0.15%), Cuban ($81,483, a difference of 0.21%), Bangladeshi ($81,363, a difference of 0.36%), and Immigrants from Dominica ($81,351, a difference of 0.37%).
| Demographics | Rating | Rank | Householder Income Ages 25 - 44 years |
| Immigrants | Somalia | 0.1 /100 | #285 | Tragic $82,188 |
| Ute | 0.1 /100 | #286 | Tragic $82,166 |
| Immigrants | Latin America | 0.1 /100 | #287 | Tragic $82,166 |
| Comanche | 0.1 /100 | #288 | Tragic $82,152 |
| Shoshone | 0.1 /100 | #289 | Tragic $82,062 |
| Liberians | 0.1 /100 | #290 | Tragic $82,005 |
| Potawatomi | 0.1 /100 | #291 | Tragic $81,774 |
| Yaqui | 0.1 /100 | #292 | Tragic $81,656 |
| Blackfeet | 0.1 /100 | #293 | Tragic $81,531 |
| Cubans | 0.1 /100 | #294 | Tragic $81,483 |
| Bangladeshis | 0.1 /100 | #295 | Tragic $81,363 |
| Immigrants | Dominica | 0.1 /100 | #296 | Tragic $81,351 |
| Immigrants | Guatemala | 0.1 /100 | #297 | Tragic $81,341 |
| Dominicans | 0.1 /100 | #298 | Tragic $81,229 |
| Immigrants | Liberia | 0.1 /100 | #299 | Tragic $80,863 |
Demographics Similar to Israelis by Householder Income Ages 25 - 44 years
In terms of householder income ages 25 - 44 years, the demographic groups most similar to Israelis are Immigrants from Indonesia ($107,627, a difference of 0.040%), Immigrants from Malaysia ($107,650, a difference of 0.070%), Immigrants from Belarus ($107,393, a difference of 0.17%), Estonian ($107,269, a difference of 0.29%), and Bulgarian ($107,264, a difference of 0.29%).
| Demographics | Rating | Rank | Householder Income Ages 25 - 44 years |
| Soviet Union | 100.0 /100 | #38 | Exceptional $108,457 |
| Immigrants | France | 99.9 /100 | #39 | Exceptional $108,257 |
| Immigrants | Lithuania | 99.9 /100 | #40 | Exceptional $108,149 |
| Immigrants | Bolivia | 99.9 /100 | #41 | Exceptional $108,128 |
| Australians | 99.9 /100 | #42 | Exceptional $107,912 |
| Immigrants | Malaysia | 99.9 /100 | #43 | Exceptional $107,650 |
| Immigrants | Indonesia | 99.9 /100 | #44 | Exceptional $107,627 |
| Israelis | 99.9 /100 | #45 | Exceptional $107,579 |
| Immigrants | Belarus | 99.9 /100 | #46 | Exceptional $107,393 |
| Estonians | 99.9 /100 | #47 | Exceptional $107,269 |
| Bulgarians | 99.9 /100 | #48 | Exceptional $107,264 |
| Immigrants | Turkey | 99.9 /100 | #49 | Exceptional $107,258 |
| Cambodians | 99.9 /100 | #50 | Exceptional $107,148 |
| Immigrants | Czechoslovakia | 99.9 /100 | #51 | Exceptional $106,888 |
| Immigrants | Europe | 99.9 /100 | #52 | Exceptional $106,817 |