Lebanese vs Scotch-Irish Median Household Income
COMPARE
Lebanese
Scotch-Irish
Median Household Income
Median Household Income Comparison
Lebanese
Scotch-Irish
$88,091
MEDIAN HOUSEHOLD INCOME
87.2/ 100
METRIC RATING
140th/ 347
METRIC RANK
$80,972
MEDIAN HOUSEHOLD INCOME
6.6/ 100
METRIC RATING
225th/ 347
METRIC RANK
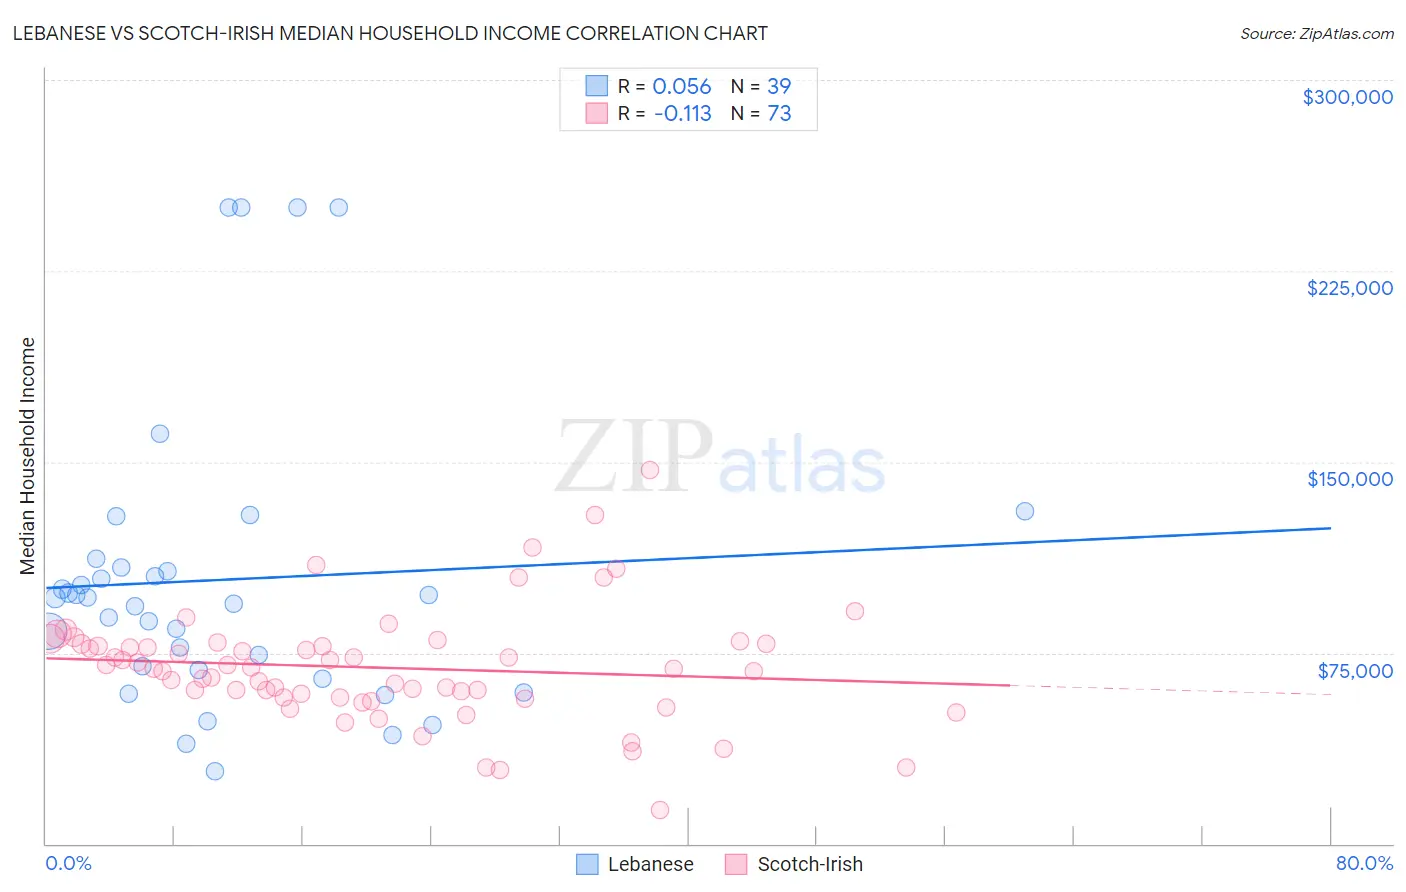
Lebanese vs Scotch-Irish Median Household Income Correlation Chart
The statistical analysis conducted on geographies consisting of 401,232,119 people shows a slight positive correlation between the proportion of Lebanese and median household income in the United States with a correlation coefficient (R) of 0.056 and weighted average of $88,091. Similarly, the statistical analysis conducted on geographies consisting of 548,026,119 people shows a poor negative correlation between the proportion of Scotch-Irish and median household income in the United States with a correlation coefficient (R) of -0.113 and weighted average of $80,972, a difference of 8.8%.
Median Household Income Correlation Summary
| Measurement | Lebanese | Scotch-Irish |
| Minimum | $28,348 | $13,333 |
| Maximum | $250,001 | $146,875 |
| Range | $221,653 | $133,542 |
| Mean | $103,665 | $69,187 |
| Median | $96,621 | $68,778 |
| Interquartile 25% (IQ1) | $68,125 | $57,401 |
| Interquartile 75% (IQ3) | $108,387 | $78,673 |
| Interquartile Range (IQR) | $40,262 | $21,272 |
| Standard Deviation (Sample) | $57,143 | $22,180 |
| Standard Deviation (Population) | $56,406 | $22,027 |
Similar Demographics by Median Household Income
Demographics Similar to Lebanese by Median Household Income
In terms of median household income, the demographic groups most similar to Lebanese are Immigrants from Morocco ($87,930, a difference of 0.18%), Immigrants from Chile ($88,388, a difference of 0.34%), Arab ($88,398, a difference of 0.35%), Canadian ($87,769, a difference of 0.37%), and Sierra Leonean ($88,463, a difference of 0.42%).
| Demographics | Rating | Rank | Median Household Income |
| Immigrants | Ethiopia | 90.9 /100 | #133 | Exceptional $88,687 |
| Swedes | 90.0 /100 | #134 | Exceptional $88,524 |
| Immigrants | Sierra Leone | 89.9 /100 | #135 | Excellent $88,498 |
| Poles | 89.7 /100 | #136 | Excellent $88,472 |
| Sierra Leoneans | 89.6 /100 | #137 | Excellent $88,463 |
| Arabs | 89.2 /100 | #138 | Excellent $88,398 |
| Immigrants | Chile | 89.2 /100 | #139 | Excellent $88,388 |
| Lebanese | 87.2 /100 | #140 | Excellent $88,091 |
| Immigrants | Morocco | 86.0 /100 | #141 | Excellent $87,930 |
| Canadians | 84.7 /100 | #142 | Excellent $87,769 |
| Danes | 83.9 /100 | #143 | Excellent $87,676 |
| Serbians | 83.0 /100 | #144 | Excellent $87,572 |
| Ugandans | 82.9 /100 | #145 | Excellent $87,557 |
| Immigrants | Uganda | 82.8 /100 | #146 | Excellent $87,553 |
| South American Indians | 81.8 /100 | #147 | Excellent $87,446 |
Demographics Similar to Scotch-Irish by Median Household Income
In terms of median household income, the demographic groups most similar to Scotch-Irish are Malaysian ($81,064, a difference of 0.11%), Immigrants from Panama ($80,873, a difference of 0.12%), Guyanese ($80,734, a difference of 0.29%), Immigrants from El Salvador ($81,213, a difference of 0.30%), and Immigrants from Bangladesh ($80,722, a difference of 0.31%).
| Demographics | Rating | Rank | Median Household Income |
| Whites/Caucasians | 12.2 /100 | #218 | Poor $82,029 |
| Nigerians | 10.3 /100 | #219 | Poor $81,725 |
| Immigrants | Venezuela | 9.0 /100 | #220 | Tragic $81,506 |
| Immigrants | Ghana | 9.0 /100 | #221 | Tragic $81,489 |
| Immigrants | Nigeria | 7.7 /100 | #222 | Tragic $81,236 |
| Immigrants | El Salvador | 7.6 /100 | #223 | Tragic $81,213 |
| Malaysians | 7.0 /100 | #224 | Tragic $81,064 |
| Scotch-Irish | 6.6 /100 | #225 | Tragic $80,972 |
| Immigrants | Panama | 6.2 /100 | #226 | Tragic $80,873 |
| Guyanese | 5.7 /100 | #227 | Tragic $80,734 |
| Immigrants | Bangladesh | 5.7 /100 | #228 | Tragic $80,722 |
| Delaware | 5.0 /100 | #229 | Tragic $80,527 |
| Bermudans | 4.7 /100 | #230 | Tragic $80,406 |
| Trinidadians and Tobagonians | 4.7 /100 | #231 | Tragic $80,402 |
| Immigrants | Trinidad and Tobago | 4.6 /100 | #232 | Tragic $80,373 |