Pennsylvania German vs Scotch-Irish Median Household Income
COMPARE
Pennsylvania German
Scotch-Irish
Median Household Income
Median Household Income Comparison
Pennsylvania Germans
Scotch-Irish
$75,814
MEDIAN HOUSEHOLD INCOME
0.3/ 100
METRIC RATING
271st/ 347
METRIC RANK
$80,972
MEDIAN HOUSEHOLD INCOME
6.6/ 100
METRIC RATING
225th/ 347
METRIC RANK
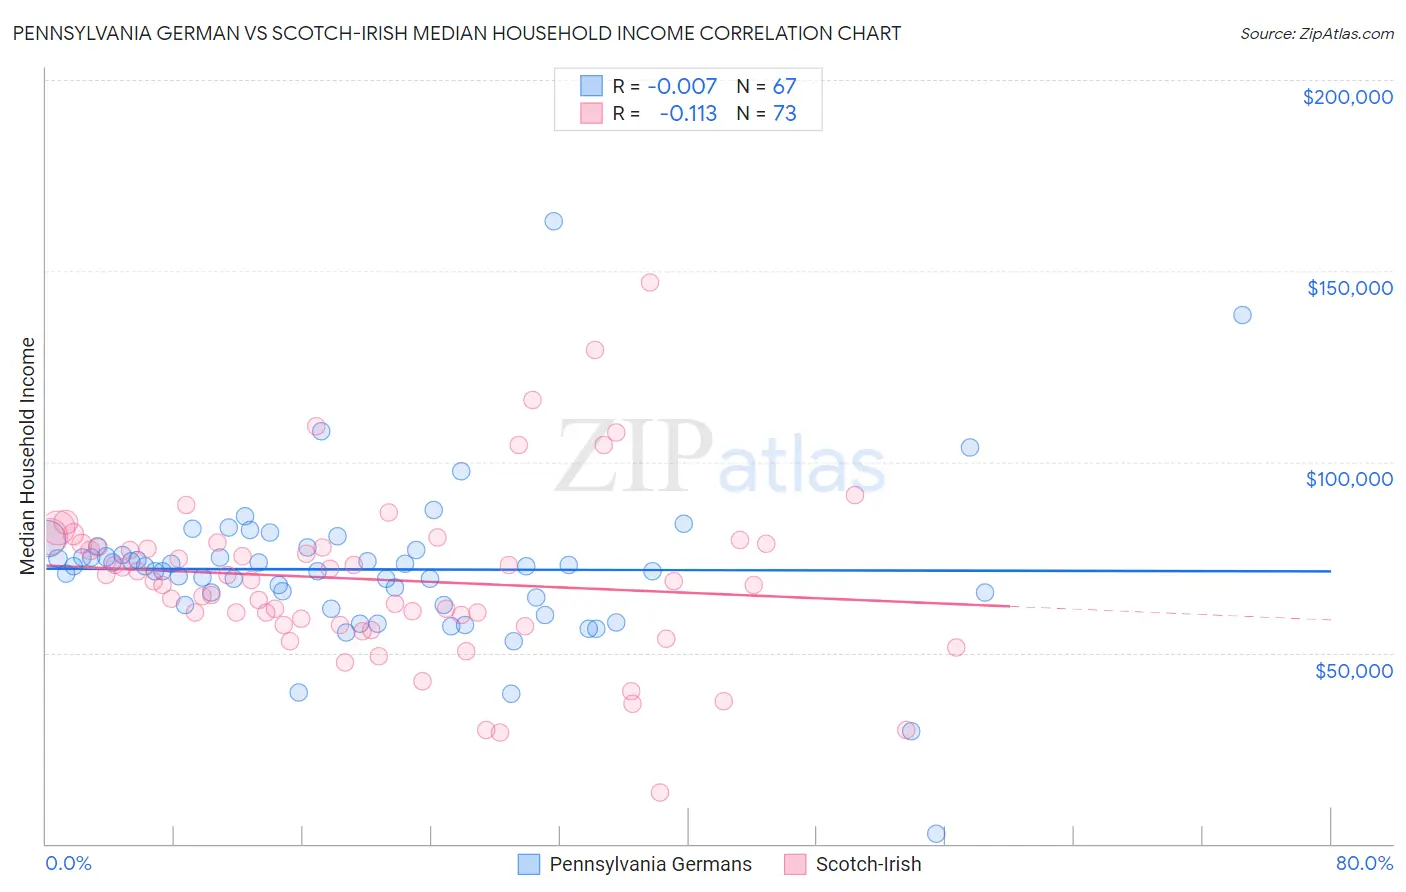
Pennsylvania German vs Scotch-Irish Median Household Income Correlation Chart
The statistical analysis conducted on geographies consisting of 234,029,688 people shows no correlation between the proportion of Pennsylvania Germans and median household income in the United States with a correlation coefficient (R) of -0.007 and weighted average of $75,814. Similarly, the statistical analysis conducted on geographies consisting of 548,026,119 people shows a poor negative correlation between the proportion of Scotch-Irish and median household income in the United States with a correlation coefficient (R) of -0.113 and weighted average of $80,972, a difference of 6.8%.
Median Household Income Correlation Summary
| Measurement | Pennsylvania German | Scotch-Irish |
| Minimum | $2,499 | $13,333 |
| Maximum | $162,917 | $146,875 |
| Range | $160,418 | $133,542 |
| Mean | $71,846 | $69,187 |
| Median | $72,559 | $68,778 |
| Interquartile 25% (IQ1) | $62,513 | $57,401 |
| Interquartile 75% (IQ3) | $76,865 | $78,673 |
| Interquartile Range (IQR) | $14,352 | $21,272 |
| Standard Deviation (Sample) | $20,812 | $22,180 |
| Standard Deviation (Population) | $20,656 | $22,027 |
Similar Demographics by Median Household Income
Demographics Similar to Pennsylvania Germans by Median Household Income
In terms of median household income, the demographic groups most similar to Pennsylvania Germans are Hmong ($75,839, a difference of 0.030%), Somali ($75,782, a difference of 0.040%), Immigrants from Jamaica ($75,851, a difference of 0.050%), Cape Verdean ($75,848, a difference of 0.050%), and German Russian ($75,856, a difference of 0.060%).
| Demographics | Rating | Rank | Median Household Income |
| Guatemalans | 0.3 /100 | #264 | Tragic $75,961 |
| Immigrants | Belize | 0.3 /100 | #265 | Tragic $75,938 |
| Americans | 0.3 /100 | #266 | Tragic $75,932 |
| German Russians | 0.3 /100 | #267 | Tragic $75,856 |
| Immigrants | Jamaica | 0.3 /100 | #268 | Tragic $75,851 |
| Cape Verdeans | 0.3 /100 | #269 | Tragic $75,848 |
| Hmong | 0.3 /100 | #270 | Tragic $75,839 |
| Pennsylvania Germans | 0.3 /100 | #271 | Tragic $75,814 |
| Somalis | 0.3 /100 | #272 | Tragic $75,782 |
| Liberians | 0.2 /100 | #273 | Tragic $75,667 |
| British West Indians | 0.2 /100 | #274 | Tragic $75,647 |
| Immigrants | Micronesia | 0.2 /100 | #275 | Tragic $75,574 |
| Immigrants | Latin America | 0.2 /100 | #276 | Tragic $75,420 |
| Spanish Americans | 0.2 /100 | #277 | Tragic $75,386 |
| Osage | 0.2 /100 | #278 | Tragic $75,240 |
Demographics Similar to Scotch-Irish by Median Household Income
In terms of median household income, the demographic groups most similar to Scotch-Irish are Malaysian ($81,064, a difference of 0.11%), Immigrants from Panama ($80,873, a difference of 0.12%), Guyanese ($80,734, a difference of 0.29%), Immigrants from El Salvador ($81,213, a difference of 0.30%), and Immigrants from Bangladesh ($80,722, a difference of 0.31%).
| Demographics | Rating | Rank | Median Household Income |
| Whites/Caucasians | 12.2 /100 | #218 | Poor $82,029 |
| Nigerians | 10.3 /100 | #219 | Poor $81,725 |
| Immigrants | Venezuela | 9.0 /100 | #220 | Tragic $81,506 |
| Immigrants | Ghana | 9.0 /100 | #221 | Tragic $81,489 |
| Immigrants | Nigeria | 7.7 /100 | #222 | Tragic $81,236 |
| Immigrants | El Salvador | 7.6 /100 | #223 | Tragic $81,213 |
| Malaysians | 7.0 /100 | #224 | Tragic $81,064 |
| Scotch-Irish | 6.6 /100 | #225 | Tragic $80,972 |
| Immigrants | Panama | 6.2 /100 | #226 | Tragic $80,873 |
| Guyanese | 5.7 /100 | #227 | Tragic $80,734 |
| Immigrants | Bangladesh | 5.7 /100 | #228 | Tragic $80,722 |
| Delaware | 5.0 /100 | #229 | Tragic $80,527 |
| Bermudans | 4.7 /100 | #230 | Tragic $80,406 |
| Trinidadians and Tobagonians | 4.7 /100 | #231 | Tragic $80,402 |
| Immigrants | Trinidad and Tobago | 4.6 /100 | #232 | Tragic $80,373 |