Norwegian vs Burmese Median Household Income
COMPARE
Norwegian
Burmese
Median Household Income
Median Household Income Comparison
Norwegians
Burmese
$86,084
MEDIAN HOUSEHOLD INCOME
65.3/ 100
METRIC RATING
165th/ 347
METRIC RANK
$103,145
MEDIAN HOUSEHOLD INCOME
100.0/ 100
METRIC RATING
16th/ 347
METRIC RANK
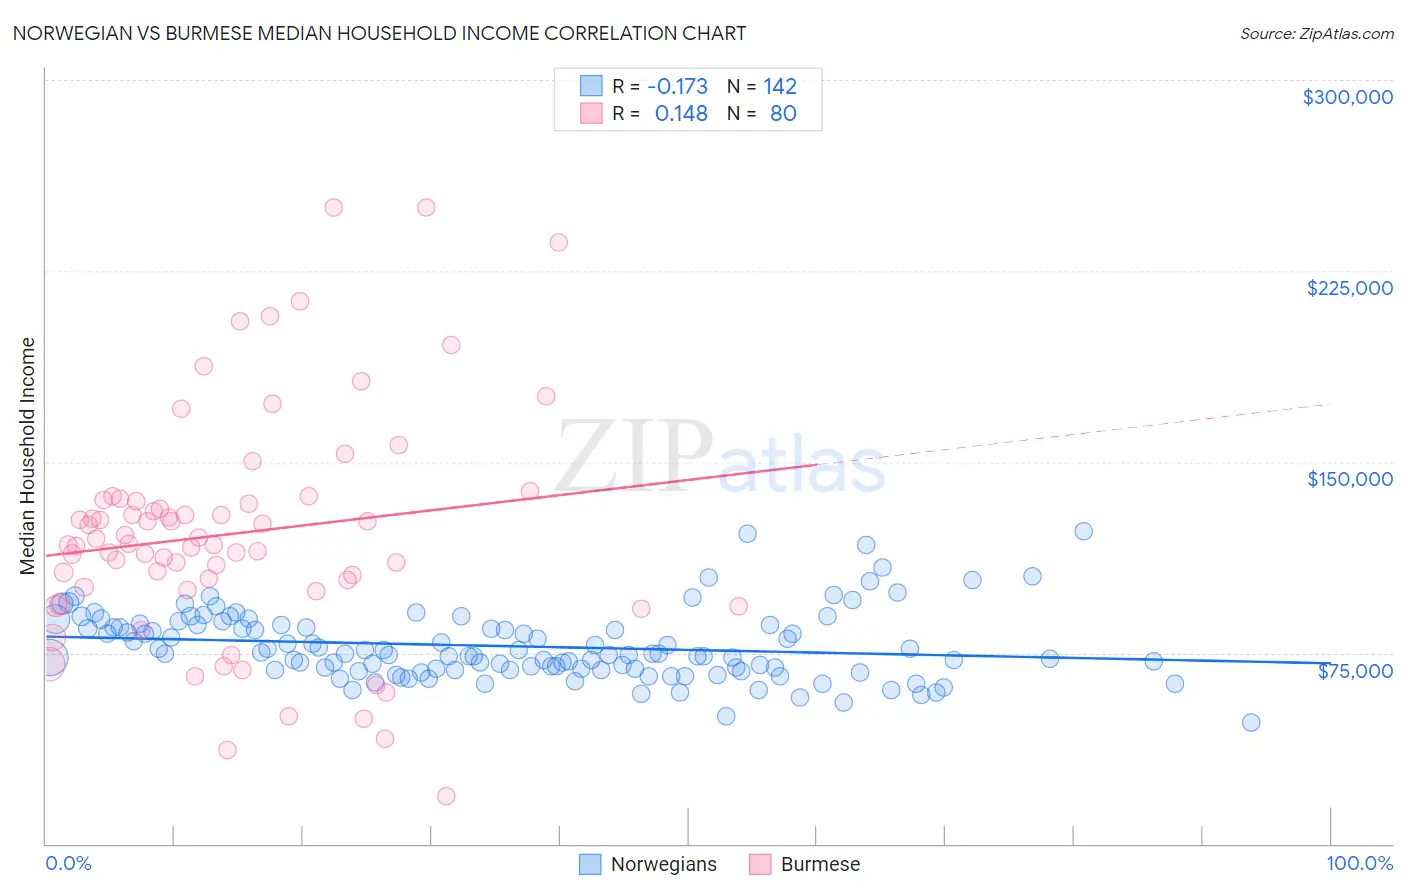
Norwegian vs Burmese Median Household Income Correlation Chart
The statistical analysis conducted on geographies consisting of 532,629,578 people shows a poor negative correlation between the proportion of Norwegians and median household income in the United States with a correlation coefficient (R) of -0.173 and weighted average of $86,084. Similarly, the statistical analysis conducted on geographies consisting of 464,741,598 people shows a poor positive correlation between the proportion of Burmese and median household income in the United States with a correlation coefficient (R) of 0.148 and weighted average of $103,145, a difference of 19.8%.
Median Household Income Correlation Summary
| Measurement | Norwegian | Burmese |
| Minimum | $47,500 | $18,739 |
| Maximum | $122,560 | $250,001 |
| Range | $75,060 | $231,262 |
| Mean | $77,577 | $121,887 |
| Median | $74,729 | $117,660 |
| Interquartile 25% (IQ1) | $68,461 | $100,120 |
| Interquartile 75% (IQ3) | $85,771 | $134,790 |
| Interquartile Range (IQR) | $17,310 | $34,670 |
| Standard Deviation (Sample) | $13,465 | $45,107 |
| Standard Deviation (Population) | $13,417 | $44,824 |
Similar Demographics by Median Household Income
Demographics Similar to Norwegians by Median Household Income
In terms of median household income, the demographic groups most similar to Norwegians are Scandinavian ($86,073, a difference of 0.010%), Irish ($86,145, a difference of 0.070%), Czech ($86,164, a difference of 0.090%), Guamanian/Chamorro ($86,255, a difference of 0.20%), and Immigrants ($85,818, a difference of 0.31%).
| Demographics | Rating | Rank | Median Household Income |
| Moroccans | 70.6 /100 | #158 | Good $86,468 |
| Immigrants | Uzbekistan | 70.1 /100 | #159 | Good $86,425 |
| Luxembourgers | 70.0 /100 | #160 | Good $86,418 |
| Slavs | 69.7 /100 | #161 | Good $86,398 |
| Guamanians/Chamorros | 67.7 /100 | #162 | Good $86,255 |
| Czechs | 66.4 /100 | #163 | Good $86,164 |
| Irish | 66.2 /100 | #164 | Good $86,145 |
| Norwegians | 65.3 /100 | #165 | Good $86,084 |
| Scandinavians | 65.1 /100 | #166 | Good $86,073 |
| Immigrants | Immigrants | 61.3 /100 | #167 | Good $85,818 |
| Icelanders | 61.0 /100 | #168 | Good $85,797 |
| Colombians | 59.7 /100 | #169 | Average $85,716 |
| Swiss | 59.2 /100 | #170 | Average $85,681 |
| Immigrants | South America | 58.1 /100 | #171 | Average $85,611 |
| Slovenes | 57.4 /100 | #172 | Average $85,562 |
Demographics Similar to Burmese by Median Household Income
In terms of median household income, the demographic groups most similar to Burmese are Immigrants from Korea ($102,962, a difference of 0.18%), Cypriot ($102,843, a difference of 0.29%), Immigrants from Australia ($102,562, a difference of 0.57%), Immigrants from Israel ($104,090, a difference of 0.92%), and Bolivian ($102,195, a difference of 0.93%).
| Demographics | Rating | Rank | Median Household Income |
| Okinawans | 100.0 /100 | #9 | Exceptional $106,624 |
| Immigrants | South Central Asia | 100.0 /100 | #10 | Exceptional $106,057 |
| Immigrants | China | 100.0 /100 | #11 | Exceptional $105,335 |
| Indians (Asian) | 100.0 /100 | #12 | Exceptional $105,262 |
| Immigrants | Eastern Asia | 100.0 /100 | #13 | Exceptional $104,796 |
| Immigrants | Ireland | 100.0 /100 | #14 | Exceptional $104,692 |
| Immigrants | Israel | 100.0 /100 | #15 | Exceptional $104,090 |
| Burmese | 100.0 /100 | #16 | Exceptional $103,145 |
| Immigrants | Korea | 100.0 /100 | #17 | Exceptional $102,962 |
| Cypriots | 100.0 /100 | #18 | Exceptional $102,843 |
| Immigrants | Australia | 100.0 /100 | #19 | Exceptional $102,562 |
| Bolivians | 100.0 /100 | #20 | Exceptional $102,195 |
| Eastern Europeans | 100.0 /100 | #21 | Exceptional $101,781 |
| Asians | 100.0 /100 | #22 | Exceptional $101,681 |
| Immigrants | Bolivia | 100.0 /100 | #23 | Exceptional $101,394 |