Norwegian vs Spanish American Indian Median Household Income
COMPARE
Norwegian
Spanish American Indian
Median Household Income
Median Household Income Comparison
Norwegians
Spanish American Indians
$86,084
MEDIAN HOUSEHOLD INCOME
65.3/ 100
METRIC RATING
165th/ 347
METRIC RANK
$76,670
MEDIAN HOUSEHOLD INCOME
0.4/ 100
METRIC RATING
259th/ 347
METRIC RANK
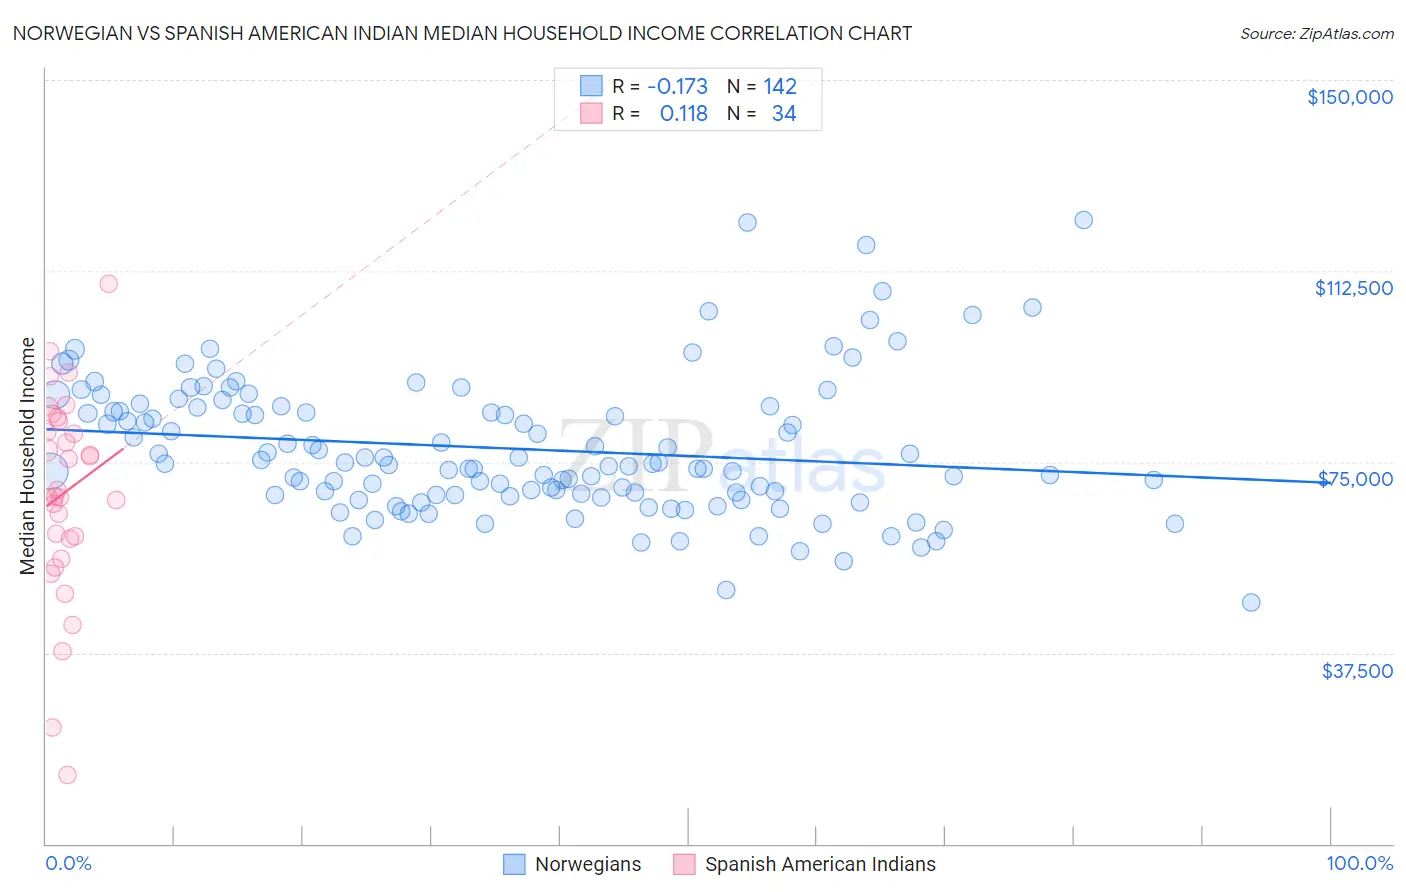
Norwegian vs Spanish American Indian Median Household Income Correlation Chart
The statistical analysis conducted on geographies consisting of 532,629,578 people shows a poor negative correlation between the proportion of Norwegians and median household income in the United States with a correlation coefficient (R) of -0.173 and weighted average of $86,084. Similarly, the statistical analysis conducted on geographies consisting of 73,142,507 people shows a poor positive correlation between the proportion of Spanish American Indians and median household income in the United States with a correlation coefficient (R) of 0.118 and weighted average of $76,670, a difference of 12.3%.
Median Household Income Correlation Summary
| Measurement | Norwegian | Spanish American Indian |
| Minimum | $47,500 | $13,474 |
| Maximum | $122,560 | $110,000 |
| Range | $75,060 | $96,526 |
| Mean | $77,577 | $68,921 |
| Median | $74,729 | $68,901 |
| Interquartile 25% (IQ1) | $68,461 | $59,929 |
| Interquartile 75% (IQ3) | $85,771 | $82,889 |
| Interquartile Range (IQR) | $17,310 | $22,960 |
| Standard Deviation (Sample) | $13,465 | $20,226 |
| Standard Deviation (Population) | $13,417 | $19,926 |
Similar Demographics by Median Household Income
Demographics Similar to Norwegians by Median Household Income
In terms of median household income, the demographic groups most similar to Norwegians are Scandinavian ($86,073, a difference of 0.010%), Irish ($86,145, a difference of 0.070%), Czech ($86,164, a difference of 0.090%), Guamanian/Chamorro ($86,255, a difference of 0.20%), and Immigrants ($85,818, a difference of 0.31%).
| Demographics | Rating | Rank | Median Household Income |
| Moroccans | 70.6 /100 | #158 | Good $86,468 |
| Immigrants | Uzbekistan | 70.1 /100 | #159 | Good $86,425 |
| Luxembourgers | 70.0 /100 | #160 | Good $86,418 |
| Slavs | 69.7 /100 | #161 | Good $86,398 |
| Guamanians/Chamorros | 67.7 /100 | #162 | Good $86,255 |
| Czechs | 66.4 /100 | #163 | Good $86,164 |
| Irish | 66.2 /100 | #164 | Good $86,145 |
| Norwegians | 65.3 /100 | #165 | Good $86,084 |
| Scandinavians | 65.1 /100 | #166 | Good $86,073 |
| Immigrants | Immigrants | 61.3 /100 | #167 | Good $85,818 |
| Icelanders | 61.0 /100 | #168 | Good $85,797 |
| Colombians | 59.7 /100 | #169 | Average $85,716 |
| Swiss | 59.2 /100 | #170 | Average $85,681 |
| Immigrants | South America | 58.1 /100 | #171 | Average $85,611 |
| Slovenes | 57.4 /100 | #172 | Average $85,562 |
Demographics Similar to Spanish American Indians by Median Household Income
In terms of median household income, the demographic groups most similar to Spanish American Indians are Jamaican ($76,583, a difference of 0.11%), Immigrants from Nicaragua ($76,784, a difference of 0.15%), Immigrants from Grenada ($76,517, a difference of 0.20%), Immigrants from Senegal ($76,915, a difference of 0.32%), and French American Indian ($76,387, a difference of 0.37%).
| Demographics | Rating | Rank | Median Household Income |
| Immigrants | West Indies | 1.0 /100 | #252 | Tragic $77,956 |
| Immigrants | St. Vincent and the Grenadines | 0.9 /100 | #253 | Tragic $77,690 |
| Sub-Saharan Africans | 0.8 /100 | #254 | Tragic $77,631 |
| Immigrants | Middle Africa | 0.8 /100 | #255 | Tragic $77,559 |
| Belizeans | 0.6 /100 | #256 | Tragic $77,028 |
| Immigrants | Senegal | 0.5 /100 | #257 | Tragic $76,915 |
| Immigrants | Nicaragua | 0.5 /100 | #258 | Tragic $76,784 |
| Spanish American Indians | 0.4 /100 | #259 | Tragic $76,670 |
| Jamaicans | 0.4 /100 | #260 | Tragic $76,583 |
| Immigrants | Grenada | 0.4 /100 | #261 | Tragic $76,517 |
| French American Indians | 0.4 /100 | #262 | Tragic $76,387 |
| Alaskan Athabascans | 0.4 /100 | #263 | Tragic $76,383 |
| Guatemalans | 0.3 /100 | #264 | Tragic $75,961 |
| Immigrants | Belize | 0.3 /100 | #265 | Tragic $75,938 |
| Americans | 0.3 /100 | #266 | Tragic $75,932 |