African vs Tlingit-Haida Single Male Poverty
COMPARE
African
Tlingit-Haida
Single Male Poverty
Single Male Poverty Comparison
Africans
Tlingit-Haida
14.7%
SINGLE MALE POVERTY
0.0/ 100
METRIC RATING
296th/ 347
METRIC RANK
11.6%
SINGLE MALE POVERTY
99.9/ 100
METRIC RATING
49th/ 347
METRIC RANK
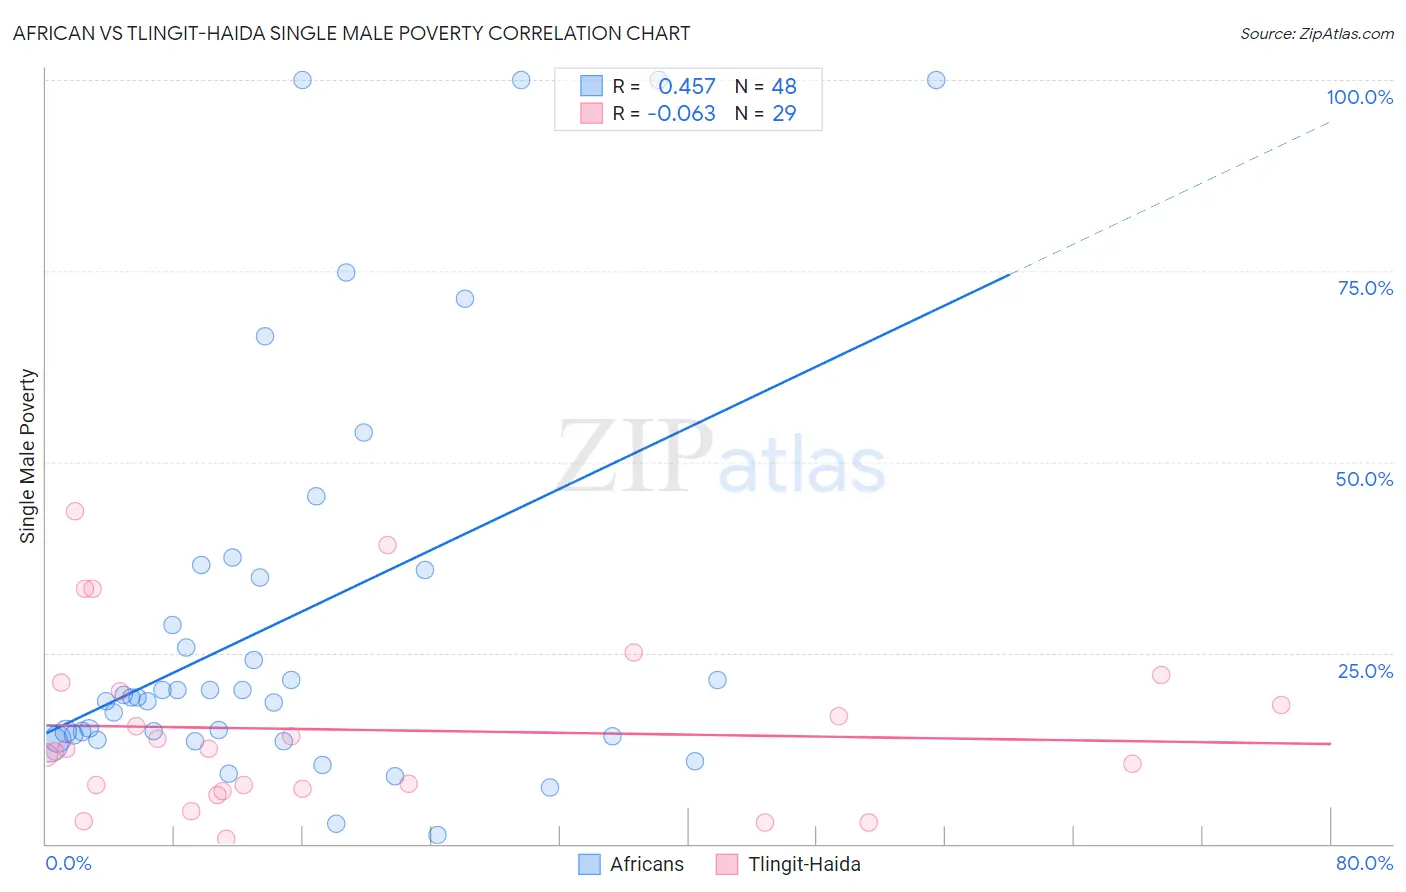
African vs Tlingit-Haida Single Male Poverty Correlation Chart
The statistical analysis conducted on geographies consisting of 417,076,777 people shows a moderate positive correlation between the proportion of Africans and poverty level among single males in the United States with a correlation coefficient (R) of 0.457 and weighted average of 14.7%. Similarly, the statistical analysis conducted on geographies consisting of 58,517,751 people shows a slight negative correlation between the proportion of Tlingit-Haida and poverty level among single males in the United States with a correlation coefficient (R) of -0.063 and weighted average of 11.6%, a difference of 27.0%.
Single Male Poverty Correlation Summary
| Measurement | African | Tlingit-Haida |
| Minimum | 1.1% | 0.66% |
| Maximum | 100.0% | 43.6% |
| Range | 98.9% | 43.0% |
| Mean | 29.4% | 14.9% |
| Median | 19.1% | 12.4% |
| Interquartile 25% (IQ1) | 13.9% | 7.1% |
| Interquartile 75% (IQ3) | 35.4% | 20.6% |
| Interquartile Range (IQR) | 21.5% | 13.5% |
| Standard Deviation (Sample) | 26.8% | 11.1% |
| Standard Deviation (Population) | 26.6% | 10.9% |
Similar Demographics by Single Male Poverty
Demographics Similar to Africans by Single Male Poverty
In terms of single male poverty, the demographic groups most similar to Africans are Scotch-Irish (14.7%, a difference of 0.33%), Immigrants from Dominican Republic (14.8%, a difference of 0.35%), Ottawa (14.6%, a difference of 0.77%), French Canadian (14.6%, a difference of 0.95%), and Nonimmigrants (14.6%, a difference of 1.1%).
| Demographics | Rating | Rank | Single Male Poverty |
| Immigrants | Dominica | 0.0 /100 | #289 | Tragic 14.5% |
| U.S. Virgin Islanders | 0.0 /100 | #290 | Tragic 14.5% |
| Bahamians | 0.0 /100 | #291 | Tragic 14.6% |
| Immigrants | Nonimmigrants | 0.0 /100 | #292 | Tragic 14.6% |
| French Canadians | 0.0 /100 | #293 | Tragic 14.6% |
| Ottawa | 0.0 /100 | #294 | Tragic 14.6% |
| Scotch-Irish | 0.0 /100 | #295 | Tragic 14.7% |
| Africans | 0.0 /100 | #296 | Tragic 14.7% |
| Immigrants | Dominican Republic | 0.0 /100 | #297 | Tragic 14.8% |
| French American Indians | 0.0 /100 | #298 | Tragic 15.0% |
| Delaware | 0.0 /100 | #299 | Tragic 15.0% |
| Cree | 0.0 /100 | #300 | Tragic 15.1% |
| Dominicans | 0.0 /100 | #301 | Tragic 15.2% |
| Alsatians | 0.0 /100 | #302 | Tragic 15.2% |
| Aleuts | 0.0 /100 | #303 | Tragic 15.4% |
Demographics Similar to Tlingit-Haida by Single Male Poverty
In terms of single male poverty, the demographic groups most similar to Tlingit-Haida are Immigrants from Indonesia (11.6%, a difference of 0.020%), Immigrants from Lithuania (11.6%, a difference of 0.060%), Nepalese (11.6%, a difference of 0.10%), Paraguayan (11.6%, a difference of 0.17%), and Immigrants from Bulgaria (11.6%, a difference of 0.29%).
| Demographics | Rating | Rank | Single Male Poverty |
| Egyptians | 99.9 /100 | #42 | Exceptional 11.5% |
| Immigrants | Peru | 99.9 /100 | #43 | Exceptional 11.5% |
| Immigrants | Cameroon | 99.9 /100 | #44 | Exceptional 11.5% |
| Immigrants | Poland | 99.9 /100 | #45 | Exceptional 11.5% |
| Immigrants | Bulgaria | 99.9 /100 | #46 | Exceptional 11.6% |
| Nepalese | 99.9 /100 | #47 | Exceptional 11.6% |
| Immigrants | Indonesia | 99.9 /100 | #48 | Exceptional 11.6% |
| Tlingit-Haida | 99.9 /100 | #49 | Exceptional 11.6% |
| Immigrants | Lithuania | 99.9 /100 | #50 | Exceptional 11.6% |
| Paraguayans | 99.9 /100 | #51 | Exceptional 11.6% |
| Samoans | 99.9 /100 | #52 | Exceptional 11.7% |
| Bulgarians | 99.9 /100 | #53 | Exceptional 11.7% |
| Immigrants | Uzbekistan | 99.9 /100 | #54 | Exceptional 11.7% |
| Cypriots | 99.9 /100 | #55 | Exceptional 11.7% |
| Burmese | 99.8 /100 | #56 | Exceptional 11.7% |