Chickasaw vs Immigrants from South Africa Single Mother Poverty
COMPARE
Chickasaw
Immigrants from South Africa
Single Mother Poverty
Single Mother Poverty Comparison
Chickasaw
Immigrants from South Africa
34.4%
SINGLE MOTHER POVERTY
0.0/ 100
METRIC RATING
314th/ 347
METRIC RANK
28.3%
SINGLE MOTHER POVERTY
93.2/ 100
METRIC RATING
113th/ 347
METRIC RANK
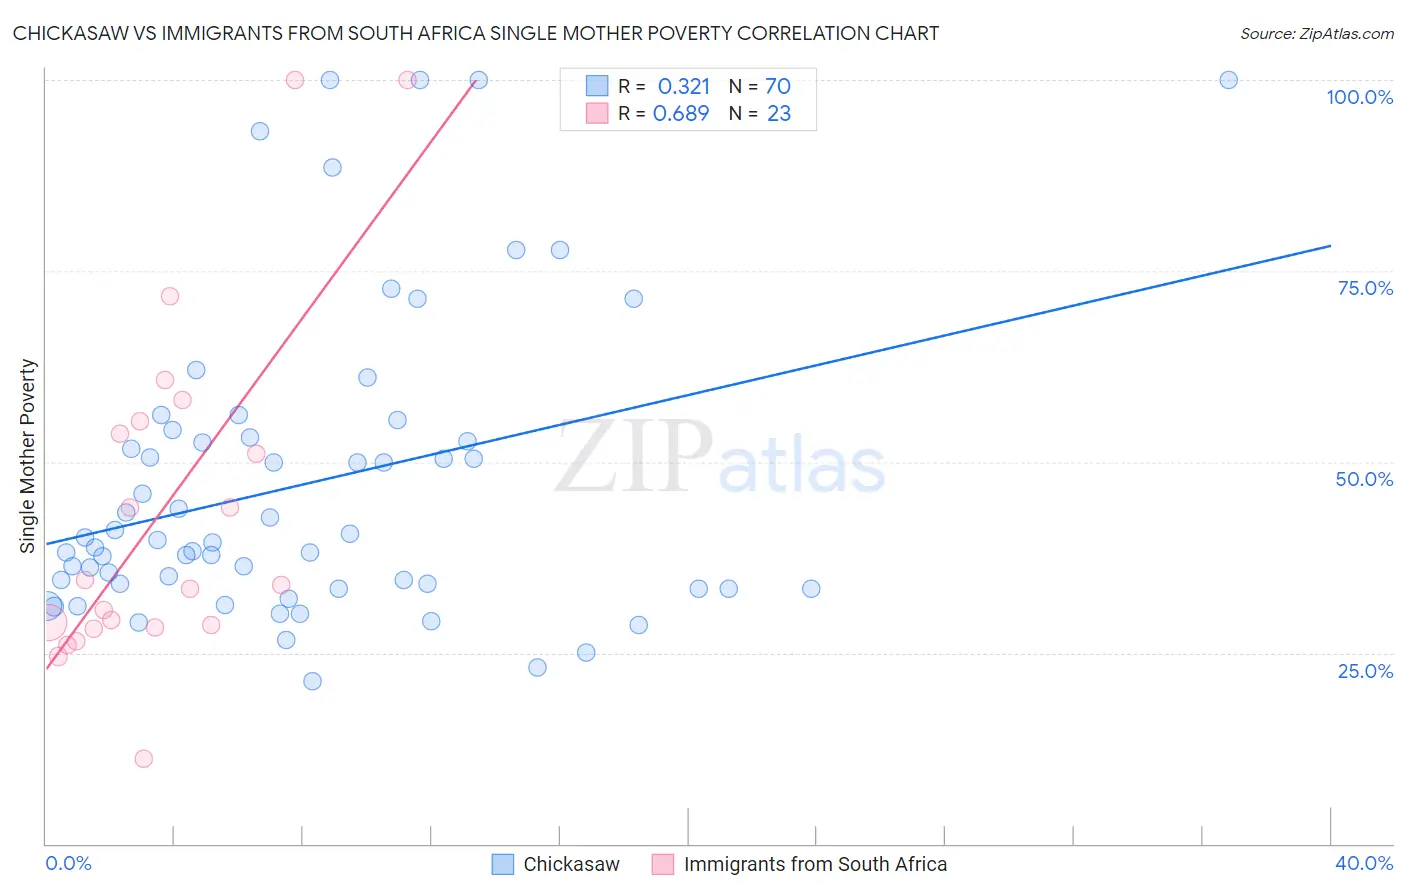
Chickasaw vs Immigrants from South Africa Single Mother Poverty Correlation Chart
The statistical analysis conducted on geographies consisting of 146,526,184 people shows a mild positive correlation between the proportion of Chickasaw and poverty level among single mothers in the United States with a correlation coefficient (R) of 0.321 and weighted average of 34.4%. Similarly, the statistical analysis conducted on geographies consisting of 228,424,231 people shows a significant positive correlation between the proportion of Immigrants from South Africa and poverty level among single mothers in the United States with a correlation coefficient (R) of 0.689 and weighted average of 28.3%, a difference of 21.8%.
Single Mother Poverty Correlation Summary
| Measurement | Chickasaw | Immigrants from South Africa |
| Minimum | 21.2% | 11.1% |
| Maximum | 100.0% | 100.0% |
| Range | 78.7% | 88.9% |
| Mean | 47.2% | 43.6% |
| Median | 39.6% | 33.8% |
| Interquartile 25% (IQ1) | 33.3% | 28.3% |
| Interquartile 75% (IQ3) | 53.2% | 55.4% |
| Interquartile Range (IQR) | 19.9% | 27.0% |
| Standard Deviation (Sample) | 20.0% | 22.9% |
| Standard Deviation (Population) | 19.8% | 22.4% |
Similar Demographics by Single Mother Poverty
Demographics Similar to Chickasaw by Single Mother Poverty
In terms of single mother poverty, the demographic groups most similar to Chickasaw are Hopi (34.5%, a difference of 0.080%), Immigrants from Dominican Republic (34.4%, a difference of 0.17%), Dominican (34.5%, a difference of 0.20%), Central American Indian (34.3%, a difference of 0.26%), and Cherokee (34.5%, a difference of 0.30%).
| Demographics | Rating | Rank | Single Mother Poverty |
| Comanche | 0.0 /100 | #307 | Tragic 33.9% |
| Immigrants | Mexico | 0.0 /100 | #308 | Tragic 34.0% |
| Potawatomi | 0.0 /100 | #309 | Tragic 34.1% |
| Hondurans | 0.0 /100 | #310 | Tragic 34.2% |
| Alsatians | 0.0 /100 | #311 | Tragic 34.3% |
| Central American Indians | 0.0 /100 | #312 | Tragic 34.3% |
| Immigrants | Dominican Republic | 0.0 /100 | #313 | Tragic 34.4% |
| Chickasaw | 0.0 /100 | #314 | Tragic 34.4% |
| Hopi | 0.0 /100 | #315 | Tragic 34.5% |
| Dominicans | 0.0 /100 | #316 | Tragic 34.5% |
| Cherokee | 0.0 /100 | #317 | Tragic 34.5% |
| Immigrants | Honduras | 0.0 /100 | #318 | Tragic 34.7% |
| Chippewa | 0.0 /100 | #319 | Tragic 34.8% |
| Iroquois | 0.0 /100 | #320 | Tragic 34.8% |
| Paiute | 0.0 /100 | #321 | Tragic 35.1% |
Demographics Similar to Immigrants from South Africa by Single Mother Poverty
In terms of single mother poverty, the demographic groups most similar to Immigrants from South Africa are Immigrants from Western Asia (28.3%, a difference of 0.090%), Immigrants from Kuwait (28.3%, a difference of 0.10%), Immigrants from Uganda (28.3%, a difference of 0.12%), Australian (28.3%, a difference of 0.13%), and Brazilian (28.3%, a difference of 0.14%).
| Demographics | Rating | Rank | Single Mother Poverty |
| Ukrainians | 96.4 /100 | #106 | Exceptional 28.0% |
| Immigrants | Venezuela | 95.8 /100 | #107 | Exceptional 28.1% |
| Immigrants | Zimbabwe | 95.5 /100 | #108 | Exceptional 28.1% |
| Immigrants | Armenia | 95.2 /100 | #109 | Exceptional 28.1% |
| Croatians | 94.8 /100 | #110 | Exceptional 28.2% |
| Venezuelans | 94.5 /100 | #111 | Exceptional 28.2% |
| Immigrants | Kazakhstan | 94.5 /100 | #112 | Exceptional 28.2% |
| Immigrants | South Africa | 93.2 /100 | #113 | Exceptional 28.3% |
| Immigrants | Western Asia | 92.7 /100 | #114 | Exceptional 28.3% |
| Immigrants | Kuwait | 92.7 /100 | #115 | Exceptional 28.3% |
| Immigrants | Uganda | 92.5 /100 | #116 | Exceptional 28.3% |
| Australians | 92.5 /100 | #117 | Exceptional 28.3% |
| Brazilians | 92.4 /100 | #118 | Exceptional 28.3% |
| Immigrants | Syria | 92.4 /100 | #119 | Exceptional 28.3% |
| Cypriots | 92.3 /100 | #120 | Exceptional 28.3% |