Cree vs English Family Poverty
COMPARE
Cree
English
Family Poverty
Family Poverty Comparison
Cree
English
10.5%
FAMILY POVERTY
0.7/ 100
METRIC RATING
244th/ 347
METRIC RANK
7.9%
FAMILY POVERTY
97.8/ 100
METRIC RATING
80th/ 347
METRIC RANK
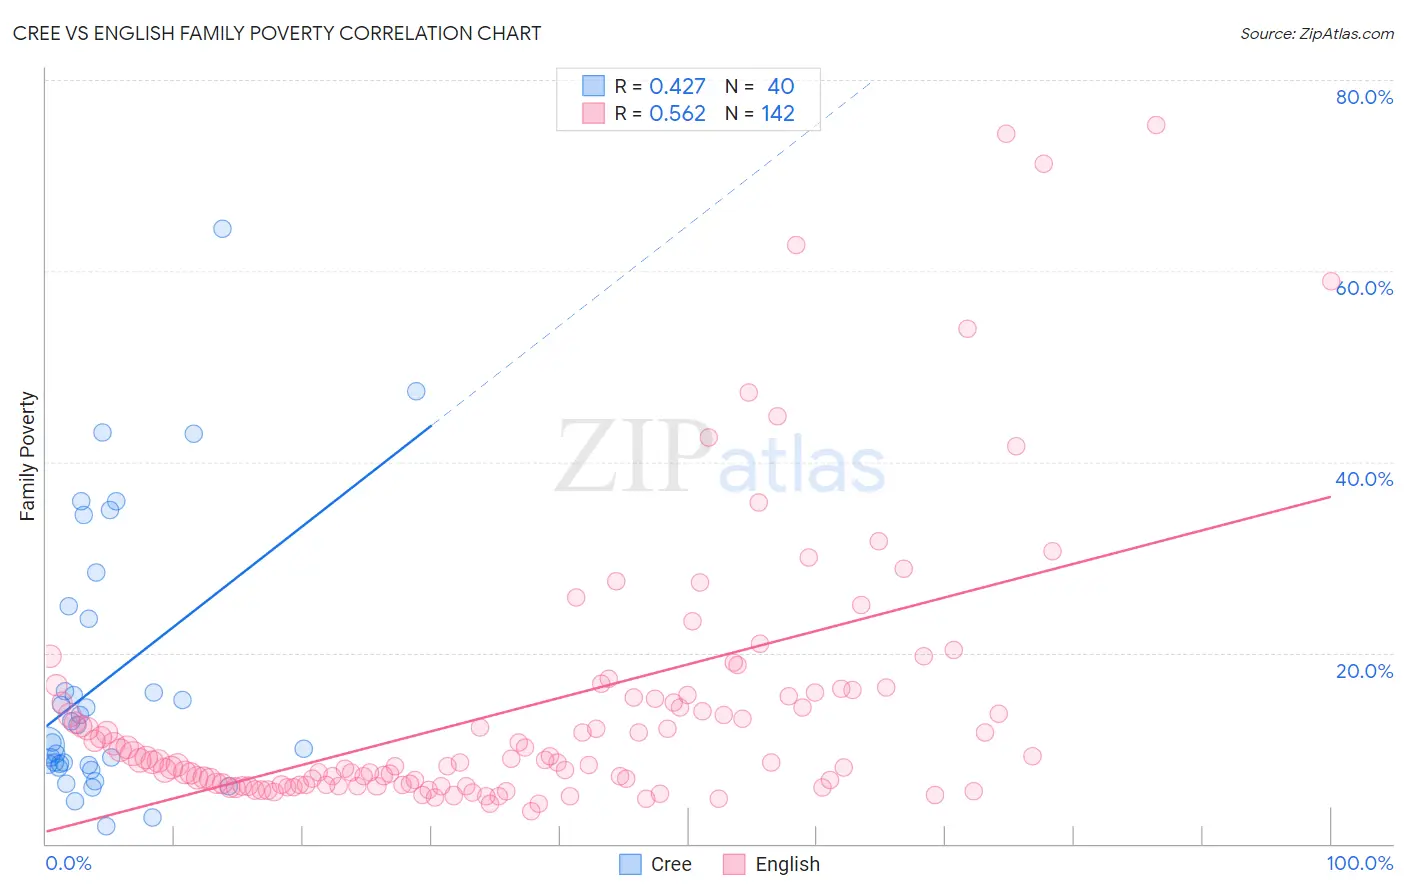
Cree vs English Family Poverty Correlation Chart
The statistical analysis conducted on geographies consisting of 76,172,191 people shows a moderate positive correlation between the proportion of Cree and poverty level among families in the United States with a correlation coefficient (R) of 0.427 and weighted average of 10.5%. Similarly, the statistical analysis conducted on geographies consisting of 573,938,644 people shows a substantial positive correlation between the proportion of English and poverty level among families in the United States with a correlation coefficient (R) of 0.562 and weighted average of 7.9%, a difference of 32.7%.
Family Poverty Correlation Summary
| Measurement | Cree | English |
| Minimum | 1.8% | 3.4% |
| Maximum | 64.4% | 75.3% |
| Range | 62.6% | 71.9% |
| Mean | 17.4% | 14.1% |
| Median | 11.6% | 8.6% |
| Interquartile 25% (IQ1) | 8.3% | 6.2% |
| Interquartile 75% (IQ3) | 24.2% | 15.3% |
| Interquartile Range (IQR) | 16.0% | 9.2% |
| Standard Deviation (Sample) | 14.4% | 13.9% |
| Standard Deviation (Population) | 14.2% | 13.9% |
Similar Demographics by Family Poverty
Demographics Similar to Cree by Family Poverty
In terms of family poverty, the demographic groups most similar to Cree are Nepalese (10.4%, a difference of 0.46%), Immigrants from Burma/Myanmar (10.5%, a difference of 0.61%), Alaska Native (10.4%, a difference of 0.94%), Cherokee (10.6%, a difference of 1.3%), and Liberian (10.6%, a difference of 1.3%).
| Demographics | Rating | Rank | Family Poverty |
| Immigrants | Laos | 1.7 /100 | #237 | Tragic 10.2% |
| French American Indians | 1.5 /100 | #238 | Tragic 10.2% |
| Potawatomi | 1.5 /100 | #239 | Tragic 10.2% |
| Immigrants | Azores | 1.4 /100 | #240 | Tragic 10.3% |
| Ghanaians | 1.3 /100 | #241 | Tragic 10.3% |
| Alaska Natives | 1.0 /100 | #242 | Tragic 10.4% |
| Nepalese | 0.8 /100 | #243 | Tragic 10.4% |
| Cree | 0.7 /100 | #244 | Tragic 10.5% |
| Immigrants | Burma/Myanmar | 0.6 /100 | #245 | Tragic 10.5% |
| Cherokee | 0.5 /100 | #246 | Tragic 10.6% |
| Liberians | 0.4 /100 | #247 | Tragic 10.6% |
| Nicaraguans | 0.4 /100 | #248 | Tragic 10.6% |
| Cubans | 0.4 /100 | #249 | Tragic 10.6% |
| Salvadorans | 0.3 /100 | #250 | Tragic 10.7% |
| Iroquois | 0.3 /100 | #251 | Tragic 10.7% |
Demographics Similar to English by Family Poverty
In terms of family poverty, the demographic groups most similar to English are Irish (7.9%, a difference of 0.010%), Immigrants from Poland (7.9%, a difference of 0.030%), Immigrants from Europe (7.9%, a difference of 0.060%), Immigrants from North America (7.9%, a difference of 0.14%), and Slovak (7.9%, a difference of 0.21%).
| Demographics | Rating | Rank | Family Poverty |
| Austrians | 98.2 /100 | #73 | Exceptional 7.8% |
| Immigrants | China | 98.1 /100 | #74 | Exceptional 7.8% |
| Immigrants | Croatia | 98.1 /100 | #75 | Exceptional 7.8% |
| Immigrants | Latvia | 98.0 /100 | #76 | Exceptional 7.9% |
| Ukrainians | 98.0 /100 | #77 | Exceptional 7.9% |
| Immigrants | North America | 97.9 /100 | #78 | Exceptional 7.9% |
| Immigrants | Europe | 97.8 /100 | #79 | Exceptional 7.9% |
| English | 97.8 /100 | #80 | Exceptional 7.9% |
| Irish | 97.8 /100 | #81 | Exceptional 7.9% |
| Immigrants | Poland | 97.8 /100 | #82 | Exceptional 7.9% |
| Slovaks | 97.7 /100 | #83 | Exceptional 7.9% |
| British | 97.5 /100 | #84 | Exceptional 7.9% |
| Immigrants | Asia | 97.4 /100 | #85 | Exceptional 7.9% |
| Scottish | 97.3 /100 | #86 | Exceptional 7.9% |
| Belgians | 97.3 /100 | #87 | Exceptional 8.0% |