Inupiat vs English Family Poverty
COMPARE
Inupiat
English
Family Poverty
Family Poverty Comparison
Inupiat
English
12.5%
FAMILY POVERTY
0.0/ 100
METRIC RATING
320th/ 347
METRIC RANK
7.9%
FAMILY POVERTY
97.8/ 100
METRIC RATING
80th/ 347
METRIC RANK
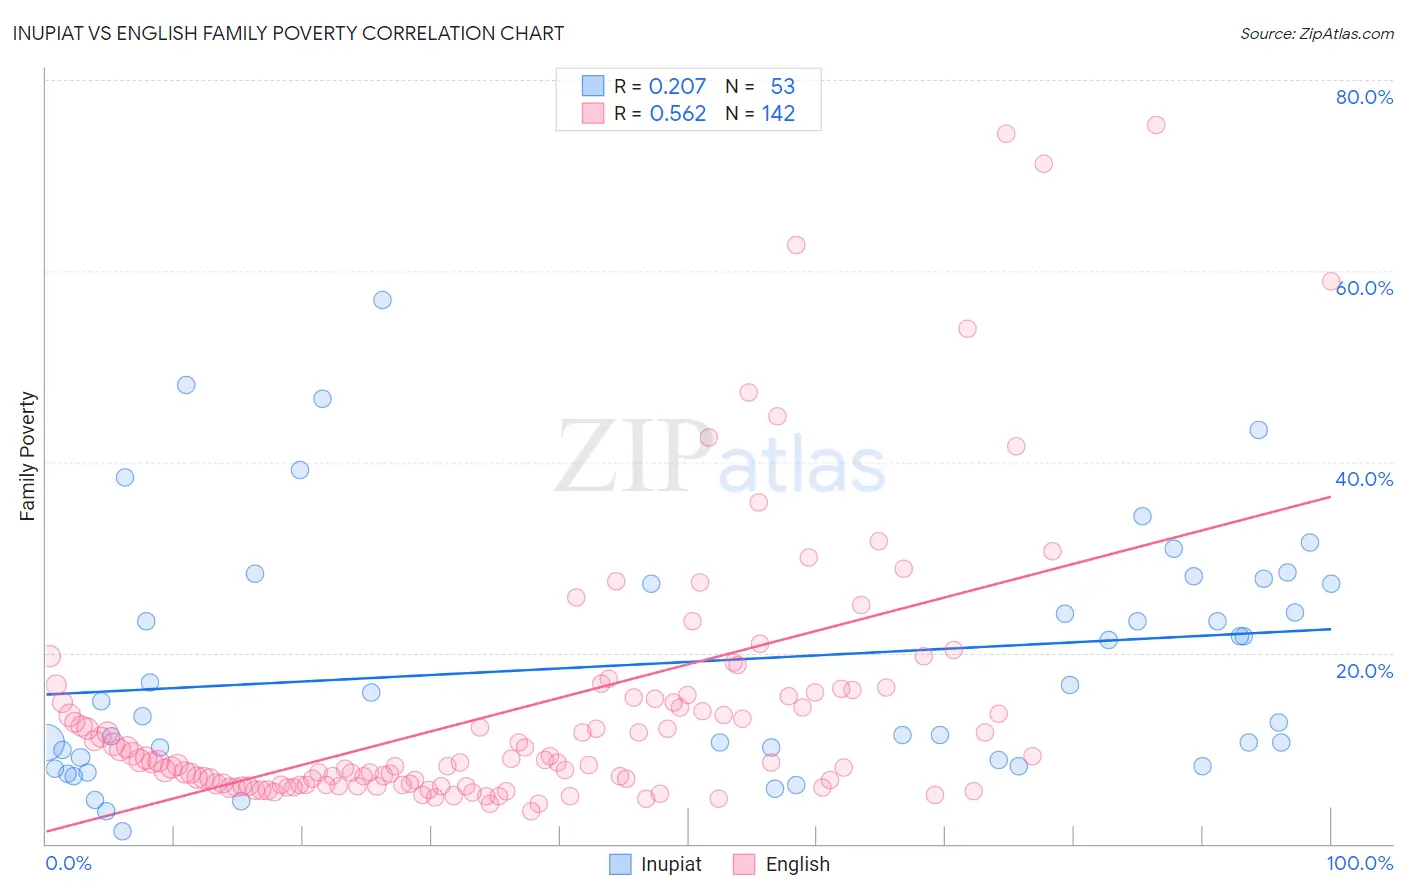
Inupiat vs English Family Poverty Correlation Chart
The statistical analysis conducted on geographies consisting of 96,272,852 people shows a weak positive correlation between the proportion of Inupiat and poverty level among families in the United States with a correlation coefficient (R) of 0.207 and weighted average of 12.5%. Similarly, the statistical analysis conducted on geographies consisting of 573,938,644 people shows a substantial positive correlation between the proportion of English and poverty level among families in the United States with a correlation coefficient (R) of 0.562 and weighted average of 7.9%, a difference of 58.0%.
Family Poverty Correlation Summary
| Measurement | Inupiat | English |
| Minimum | 1.3% | 3.4% |
| Maximum | 56.9% | 75.3% |
| Range | 55.6% | 71.9% |
| Mean | 19.0% | 14.1% |
| Median | 14.9% | 8.6% |
| Interquartile 25% (IQ1) | 8.9% | 6.2% |
| Interquartile 75% (IQ3) | 27.5% | 15.3% |
| Interquartile Range (IQR) | 18.6% | 9.2% |
| Standard Deviation (Sample) | 12.9% | 13.9% |
| Standard Deviation (Population) | 12.8% | 13.9% |
Similar Demographics by Family Poverty
Demographics Similar to Inupiat by Family Poverty
In terms of family poverty, the demographic groups most similar to Inupiat are British West Indian (12.4%, a difference of 0.48%), U.S. Virgin Islander (12.4%, a difference of 0.53%), Immigrants from Grenada (12.4%, a difference of 0.54%), Honduran (12.4%, a difference of 0.76%), and Immigrants from Mexico (12.3%, a difference of 1.5%).
| Demographics | Rating | Rank | Family Poverty |
| Immigrants | Caribbean | 0.0 /100 | #313 | Tragic 12.2% |
| Kiowa | 0.0 /100 | #314 | Tragic 12.2% |
| Immigrants | Mexico | 0.0 /100 | #315 | Tragic 12.3% |
| Hondurans | 0.0 /100 | #316 | Tragic 12.4% |
| Immigrants | Grenada | 0.0 /100 | #317 | Tragic 12.4% |
| U.S. Virgin Islanders | 0.0 /100 | #318 | Tragic 12.4% |
| British West Indians | 0.0 /100 | #319 | Tragic 12.4% |
| Inupiat | 0.0 /100 | #320 | Tragic 12.5% |
| Arapaho | 0.0 /100 | #321 | Tragic 12.7% |
| Immigrants | Honduras | 0.0 /100 | #322 | Tragic 12.7% |
| Menominee | 0.0 /100 | #323 | Tragic 12.7% |
| Immigrants | Dominica | 0.0 /100 | #324 | Tragic 12.7% |
| Paiute | 0.0 /100 | #325 | Tragic 13.0% |
| Colville | 0.0 /100 | #326 | Tragic 13.0% |
| Yakama | 0.0 /100 | #327 | Tragic 13.1% |
Demographics Similar to English by Family Poverty
In terms of family poverty, the demographic groups most similar to English are Irish (7.9%, a difference of 0.010%), Immigrants from Poland (7.9%, a difference of 0.030%), Immigrants from Europe (7.9%, a difference of 0.060%), Immigrants from North America (7.9%, a difference of 0.14%), and Slovak (7.9%, a difference of 0.21%).
| Demographics | Rating | Rank | Family Poverty |
| Austrians | 98.2 /100 | #73 | Exceptional 7.8% |
| Immigrants | China | 98.1 /100 | #74 | Exceptional 7.8% |
| Immigrants | Croatia | 98.1 /100 | #75 | Exceptional 7.8% |
| Immigrants | Latvia | 98.0 /100 | #76 | Exceptional 7.9% |
| Ukrainians | 98.0 /100 | #77 | Exceptional 7.9% |
| Immigrants | North America | 97.9 /100 | #78 | Exceptional 7.9% |
| Immigrants | Europe | 97.8 /100 | #79 | Exceptional 7.9% |
| English | 97.8 /100 | #80 | Exceptional 7.9% |
| Irish | 97.8 /100 | #81 | Exceptional 7.9% |
| Immigrants | Poland | 97.8 /100 | #82 | Exceptional 7.9% |
| Slovaks | 97.7 /100 | #83 | Exceptional 7.9% |
| British | 97.5 /100 | #84 | Exceptional 7.9% |
| Immigrants | Asia | 97.4 /100 | #85 | Exceptional 7.9% |
| Scottish | 97.3 /100 | #86 | Exceptional 7.9% |
| Belgians | 97.3 /100 | #87 | Exceptional 8.0% |