Cuban vs Immigrants from Colombia Male Poverty
COMPARE
Cuban
Immigrants from Colombia
Male Poverty
Male Poverty Comparison
Cubans
Immigrants from Colombia
12.4%
MALE POVERTY
1.3/ 100
METRIC RATING
229th/ 347
METRIC RANK
11.1%
MALE POVERTY
54.2/ 100
METRIC RATING
169th/ 347
METRIC RANK
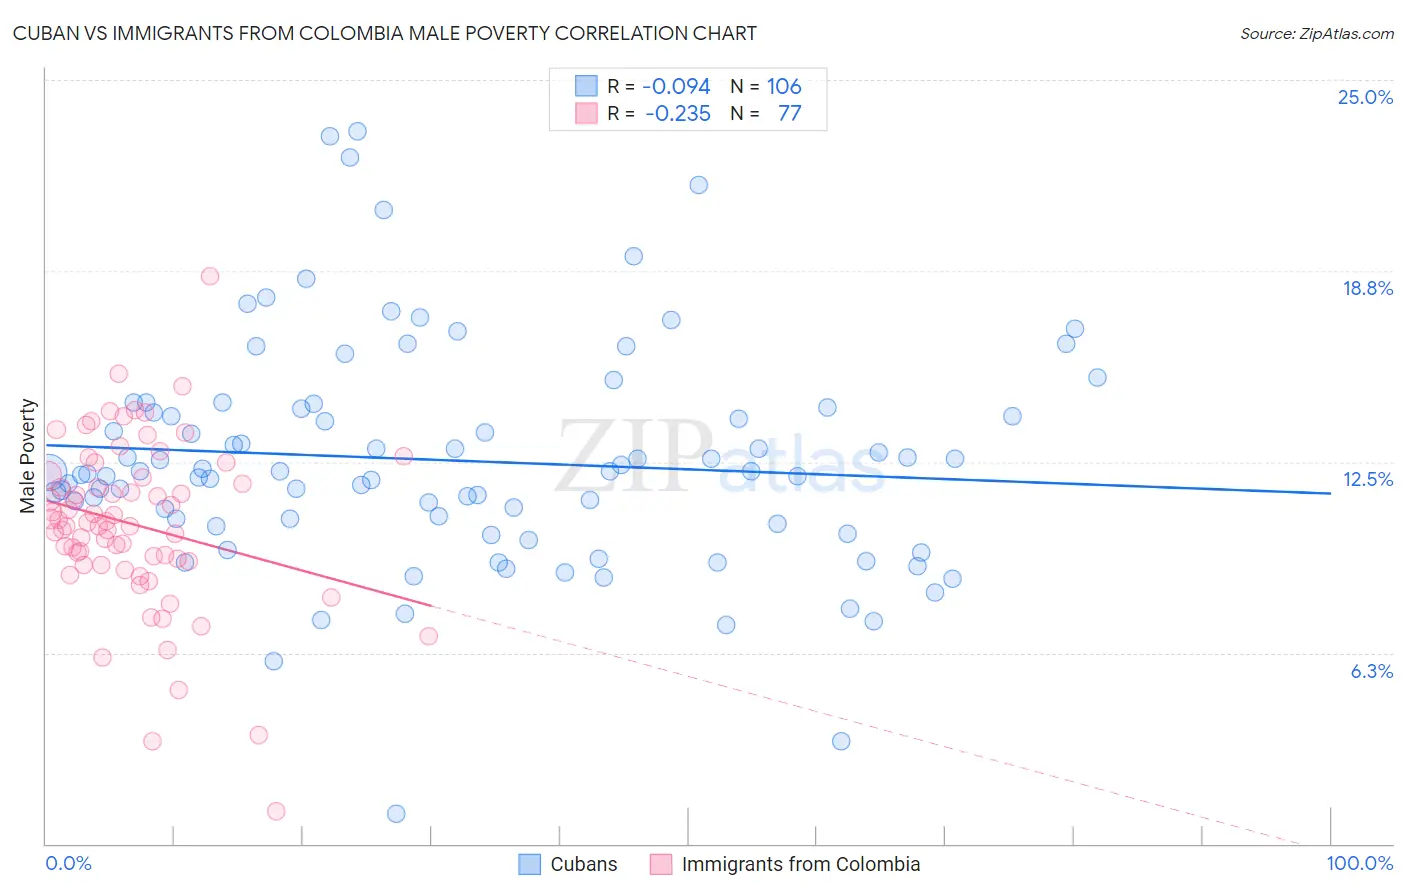
Cuban vs Immigrants from Colombia Male Poverty Correlation Chart
The statistical analysis conducted on geographies consisting of 448,765,698 people shows a slight negative correlation between the proportion of Cubans and poverty level among males in the United States with a correlation coefficient (R) of -0.094 and weighted average of 12.4%. Similarly, the statistical analysis conducted on geographies consisting of 378,363,943 people shows a weak negative correlation between the proportion of Immigrants from Colombia and poverty level among males in the United States with a correlation coefficient (R) of -0.235 and weighted average of 11.1%, a difference of 11.1%.
Male Poverty Correlation Summary
| Measurement | Cuban | Immigrants from Colombia |
| Minimum | 0.97% | 1.0% |
| Maximum | 23.3% | 18.6% |
| Range | 22.4% | 17.5% |
| Mean | 12.5% | 10.4% |
| Median | 12.2% | 10.5% |
| Interquartile 25% (IQ1) | 10.5% | 9.2% |
| Interquartile 75% (IQ3) | 14.2% | 12.0% |
| Interquartile Range (IQR) | 3.8% | 2.8% |
| Standard Deviation (Sample) | 3.7% | 2.8% |
| Standard Deviation (Population) | 3.7% | 2.8% |
Similar Demographics by Male Poverty
Demographics Similar to Cubans by Male Poverty
In terms of male poverty, the demographic groups most similar to Cubans are Alsatian (12.4%, a difference of 0.090%), Alaska Native (12.4%, a difference of 0.13%), Nigerian (12.3%, a difference of 0.23%), Osage (12.3%, a difference of 0.39%), and Immigrants from Nigeria (12.3%, a difference of 0.45%).
| Demographics | Rating | Rank | Male Poverty |
| Immigrants | Africa | 2.1 /100 | #222 | Tragic 12.2% |
| Immigrants | Micronesia | 2.1 /100 | #223 | Tragic 12.2% |
| Immigrants | Nigeria | 1.6 /100 | #224 | Tragic 12.3% |
| Osage | 1.5 /100 | #225 | Tragic 12.3% |
| Nigerians | 1.4 /100 | #226 | Tragic 12.3% |
| Alaska Natives | 1.4 /100 | #227 | Tragic 12.4% |
| Alsatians | 1.3 /100 | #228 | Tragic 12.4% |
| Cubans | 1.3 /100 | #229 | Tragic 12.4% |
| Marshallese | 0.8 /100 | #230 | Tragic 12.5% |
| Salvadorans | 0.6 /100 | #231 | Tragic 12.6% |
| Nicaraguans | 0.6 /100 | #232 | Tragic 12.6% |
| Fijians | 0.6 /100 | #233 | Tragic 12.6% |
| Immigrants | Armenia | 0.6 /100 | #234 | Tragic 12.6% |
| Immigrants | Laos | 0.5 /100 | #235 | Tragic 12.6% |
| Immigrants | Saudi Arabia | 0.4 /100 | #236 | Tragic 12.7% |
Demographics Similar to Immigrants from Colombia by Male Poverty
In terms of male poverty, the demographic groups most similar to Immigrants from Colombia are South American (11.1%, a difference of 0.040%), Immigrants from Portugal (11.1%, a difference of 0.070%), Hungarian (11.1%, a difference of 0.090%), Immigrants from Albania (11.1%, a difference of 0.11%), and Immigrants from Spain (11.1%, a difference of 0.13%).
| Demographics | Rating | Rank | Male Poverty |
| Immigrants | Chile | 57.4 /100 | #162 | Average 11.1% |
| Whites/Caucasians | 56.7 /100 | #163 | Average 11.1% |
| Ethiopians | 56.7 /100 | #164 | Average 11.1% |
| Immigrants | Spain | 55.5 /100 | #165 | Average 11.1% |
| Immigrants | Albania | 55.3 /100 | #166 | Average 11.1% |
| Hungarians | 55.1 /100 | #167 | Average 11.1% |
| Immigrants | Portugal | 54.9 /100 | #168 | Average 11.1% |
| Immigrants | Colombia | 54.2 /100 | #169 | Average 11.1% |
| South Americans | 53.8 /100 | #170 | Average 11.1% |
| Uruguayans | 51.0 /100 | #171 | Average 11.2% |
| Immigrants | Ethiopia | 50.7 /100 | #172 | Average 11.2% |
| Pennsylvania Germans | 50.5 /100 | #173 | Average 11.2% |
| Immigrants | Oceania | 50.0 /100 | #174 | Average 11.2% |
| Celtics | 47.5 /100 | #175 | Average 11.2% |
| Immigrants | Fiji | 46.0 /100 | #176 | Average 11.2% |