Czechoslovakian vs Yakama Child Poverty Among Girls Under 16
COMPARE
Czechoslovakian
Yakama
Child Poverty Among Girls Under 16
Child Poverty Among Girls Under 16 Comparison
Czechoslovakians
Yakama
15.5%
CHILD POVERTY AMONG GIRLS UNDER 16
89.0/ 100
METRIC RATING
135th/ 347
METRIC RANK
22.6%
CHILD POVERTY AMONG GIRLS UNDER 16
0.0/ 100
METRIC RATING
322nd/ 347
METRIC RANK
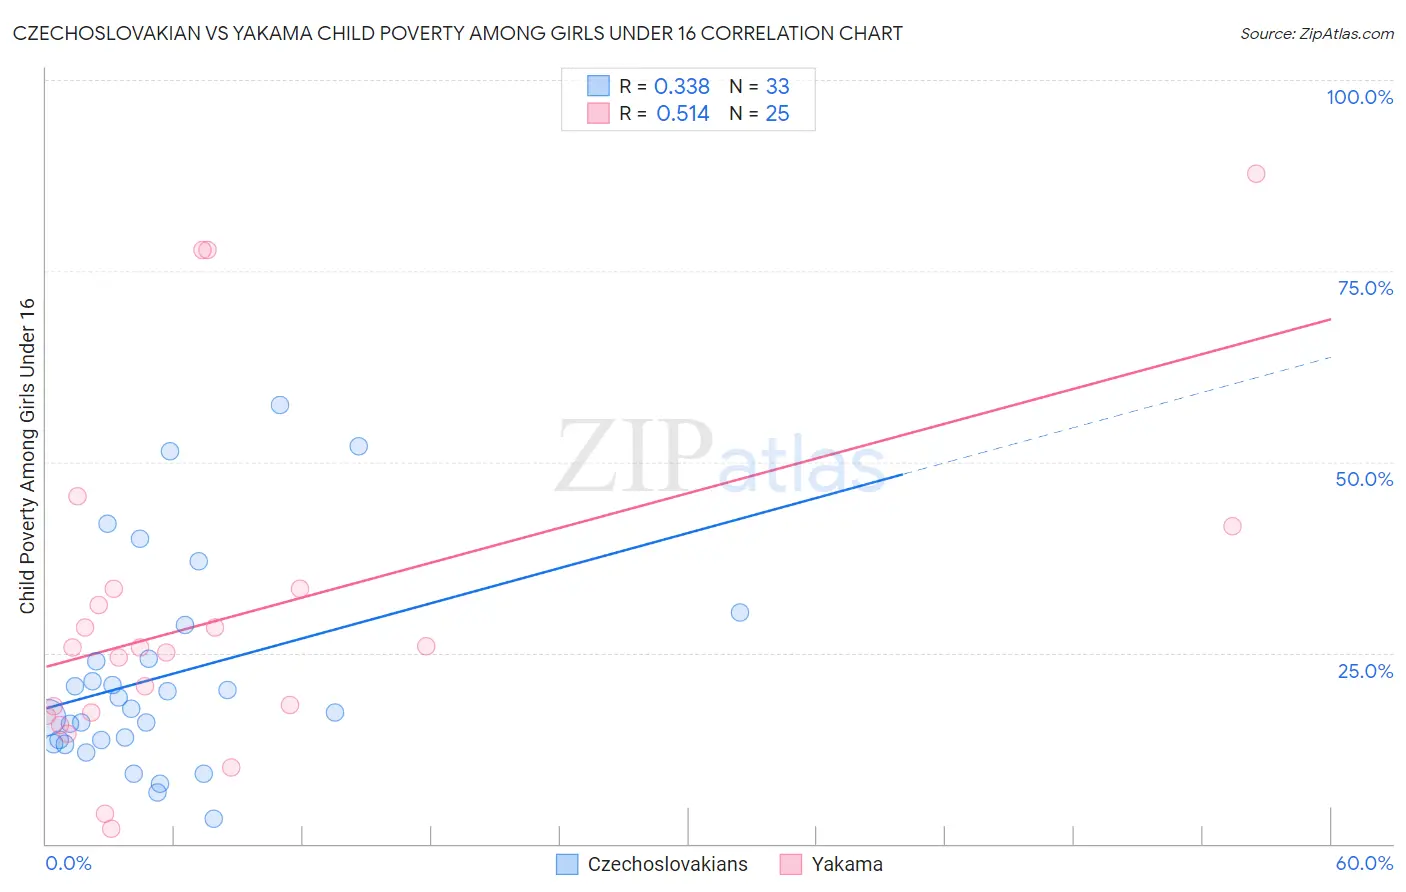
Czechoslovakian vs Yakama Child Poverty Among Girls Under 16 Correlation Chart
The statistical analysis conducted on geographies consisting of 361,103,905 people shows a mild positive correlation between the proportion of Czechoslovakians and poverty level among girls under the age of 16 in the United States with a correlation coefficient (R) of 0.338 and weighted average of 15.5%. Similarly, the statistical analysis conducted on geographies consisting of 19,841,501 people shows a substantial positive correlation between the proportion of Yakama and poverty level among girls under the age of 16 in the United States with a correlation coefficient (R) of 0.514 and weighted average of 22.6%, a difference of 45.8%.
Child Poverty Among Girls Under 16 Correlation Summary
| Measurement | Czechoslovakian | Yakama |
| Minimum | 3.3% | 2.0% |
| Maximum | 57.5% | 87.7% |
| Range | 54.2% | 85.7% |
| Mean | 21.9% | 29.9% |
| Median | 17.6% | 25.6% |
| Interquartile 25% (IQ1) | 13.3% | 17.0% |
| Interquartile 75% (IQ3) | 26.5% | 33.3% |
| Interquartile Range (IQR) | 13.1% | 16.3% |
| Standard Deviation (Sample) | 13.6% | 21.8% |
| Standard Deviation (Population) | 13.4% | 21.4% |
Similar Demographics by Child Poverty Among Girls Under 16
Demographics Similar to Czechoslovakians by Child Poverty Among Girls Under 16
In terms of child poverty among girls under 16, the demographic groups most similar to Czechoslovakians are Native Hawaiian (15.5%, a difference of 0.020%), Immigrants from Spain (15.5%, a difference of 0.030%), South African (15.5%, a difference of 0.11%), Brazilian (15.4%, a difference of 0.19%), and Mongolian (15.4%, a difference of 0.21%).
| Demographics | Rating | Rank | Child Poverty Among Girls Under 16 |
| Albanians | 90.5 /100 | #128 | Exceptional 15.4% |
| Immigrants | South Eastern Asia | 90.5 /100 | #129 | Exceptional 15.4% |
| Puget Sound Salish | 90.1 /100 | #130 | Exceptional 15.4% |
| Immigrants | Western Europe | 90.0 /100 | #131 | Exceptional 15.4% |
| Mongolians | 89.7 /100 | #132 | Excellent 15.4% |
| Brazilians | 89.6 /100 | #133 | Excellent 15.4% |
| Immigrants | Spain | 89.1 /100 | #134 | Excellent 15.5% |
| Czechoslovakians | 89.0 /100 | #135 | Excellent 15.5% |
| Native Hawaiians | 89.0 /100 | #136 | Excellent 15.5% |
| South Africans | 88.7 /100 | #137 | Excellent 15.5% |
| Immigrants | Vietnam | 88.2 /100 | #138 | Excellent 15.5% |
| Armenians | 87.9 /100 | #139 | Excellent 15.5% |
| New Zealanders | 87.2 /100 | #140 | Excellent 15.6% |
| Immigrants | Jordan | 87.2 /100 | #141 | Excellent 15.6% |
| Canadians | 87.1 /100 | #142 | Excellent 15.6% |
Demographics Similar to Yakama by Child Poverty Among Girls Under 16
In terms of child poverty among girls under 16, the demographic groups most similar to Yakama are Cajun (22.6%, a difference of 0.020%), Colville (22.5%, a difference of 0.19%), Paiute (22.6%, a difference of 0.31%), Immigrants from Congo (22.7%, a difference of 0.80%), and Immigrants from Honduras (22.8%, a difference of 0.93%).
| Demographics | Rating | Rank | Child Poverty Among Girls Under 16 |
| Ute | 0.0 /100 | #315 | Tragic 21.8% |
| Immigrants | Guatemala | 0.0 /100 | #316 | Tragic 21.9% |
| Africans | 0.0 /100 | #317 | Tragic 21.9% |
| Immigrants | Dominica | 0.0 /100 | #318 | Tragic 22.1% |
| U.S. Virgin Islanders | 0.0 /100 | #319 | Tragic 22.1% |
| Hondurans | 0.0 /100 | #320 | Tragic 22.2% |
| Colville | 0.0 /100 | #321 | Tragic 22.5% |
| Yakama | 0.0 /100 | #322 | Tragic 22.6% |
| Cajuns | 0.0 /100 | #323 | Tragic 22.6% |
| Paiute | 0.0 /100 | #324 | Tragic 22.6% |
| Immigrants | Congo | 0.0 /100 | #325 | Tragic 22.7% |
| Immigrants | Honduras | 0.0 /100 | #326 | Tragic 22.8% |
| Central American Indians | 0.0 /100 | #327 | Tragic 22.8% |
| Dominicans | 0.0 /100 | #328 | Tragic 23.7% |
| Kiowa | 0.0 /100 | #329 | Tragic 23.7% |