English vs Chippewa Female Poverty
COMPARE
English
Chippewa
Female Poverty
Female Poverty Comparison
English
Chippewa
12.4%
FEMALE POVERTY
96.1/ 100
METRIC RATING
89th/ 347
METRIC RANK
16.7%
FEMALE POVERTY
0.0/ 100
METRIC RATING
302nd/ 347
METRIC RANK
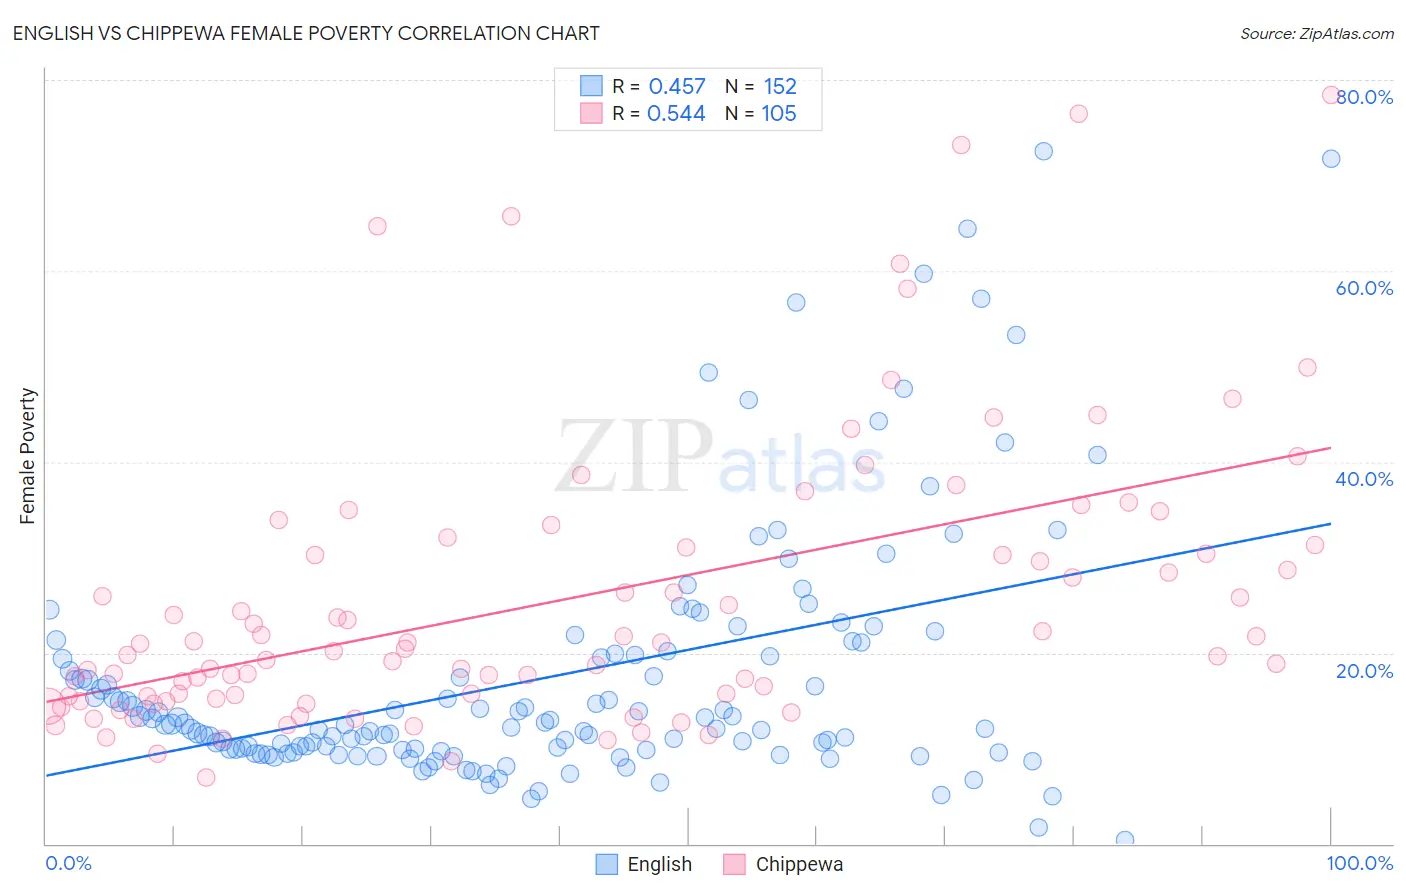
English vs Chippewa Female Poverty Correlation Chart
The statistical analysis conducted on geographies consisting of 578,145,061 people shows a moderate positive correlation between the proportion of English and poverty level among females in the United States with a correlation coefficient (R) of 0.457 and weighted average of 12.4%. Similarly, the statistical analysis conducted on geographies consisting of 214,995,312 people shows a substantial positive correlation between the proportion of Chippewa and poverty level among females in the United States with a correlation coefficient (R) of 0.544 and weighted average of 16.7%, a difference of 34.7%.
Female Poverty Correlation Summary
| Measurement | English | Chippewa |
| Minimum | 0.38% | 7.0% |
| Maximum | 72.5% | 78.4% |
| Range | 72.2% | 71.4% |
| Mean | 17.3% | 25.6% |
| Median | 12.4% | 20.4% |
| Interquartile 25% (IQ1) | 9.8% | 15.3% |
| Interquartile 75% (IQ3) | 19.7% | 31.2% |
| Interquartile Range (IQR) | 9.9% | 15.8% |
| Standard Deviation (Sample) | 13.4% | 15.1% |
| Standard Deviation (Population) | 13.3% | 15.0% |
Similar Demographics by Female Poverty
Demographics Similar to English by Female Poverty
In terms of female poverty, the demographic groups most similar to English are Finnish (12.4%, a difference of 0.20%), Immigrants from Denmark (12.4%, a difference of 0.22%), Belgian (12.4%, a difference of 0.23%), Okinawan (12.4%, a difference of 0.24%), and Czechoslovakian (12.4%, a difference of 0.24%).
| Demographics | Rating | Rank | Female Poverty |
| Jordanians | 97.1 /100 | #82 | Exceptional 12.3% |
| Immigrants | England | 96.9 /100 | #83 | Exceptional 12.3% |
| Northern Europeans | 96.6 /100 | #84 | Exceptional 12.4% |
| Irish | 96.5 /100 | #85 | Exceptional 12.4% |
| Dutch | 96.5 /100 | #86 | Exceptional 12.4% |
| Okinawans | 96.4 /100 | #87 | Exceptional 12.4% |
| Finns | 96.4 /100 | #88 | Exceptional 12.4% |
| English | 96.1 /100 | #89 | Exceptional 12.4% |
| Immigrants | Denmark | 95.8 /100 | #90 | Exceptional 12.4% |
| Belgians | 95.8 /100 | #91 | Exceptional 12.4% |
| Czechoslovakians | 95.7 /100 | #92 | Exceptional 12.4% |
| Immigrants | Egypt | 95.5 /100 | #93 | Exceptional 12.5% |
| Immigrants | Indonesia | 95.4 /100 | #94 | Exceptional 12.5% |
| Immigrants | South Africa | 95.4 /100 | #95 | Exceptional 12.5% |
| British | 95.2 /100 | #96 | Exceptional 12.5% |
Demographics Similar to Chippewa by Female Poverty
In terms of female poverty, the demographic groups most similar to Chippewa are Guatemalan (16.7%, a difference of 0.030%), Bahamian (16.6%, a difference of 0.36%), Hispanic or Latino (16.6%, a difference of 0.40%), Choctaw (16.8%, a difference of 0.61%), and Immigrants from Central America (16.8%, a difference of 0.67%).
| Demographics | Rating | Rank | Female Poverty |
| Senegalese | 0.0 /100 | #295 | Tragic 16.5% |
| Immigrants | Senegal | 0.0 /100 | #296 | Tragic 16.5% |
| Mexicans | 0.0 /100 | #297 | Tragic 16.5% |
| Somalis | 0.0 /100 | #298 | Tragic 16.6% |
| Hispanics or Latinos | 0.0 /100 | #299 | Tragic 16.6% |
| Bahamians | 0.0 /100 | #300 | Tragic 16.6% |
| Guatemalans | 0.0 /100 | #301 | Tragic 16.7% |
| Chippewa | 0.0 /100 | #302 | Tragic 16.7% |
| Choctaw | 0.0 /100 | #303 | Tragic 16.8% |
| Immigrants | Central America | 0.0 /100 | #304 | Tragic 16.8% |
| Immigrants | Grenada | 0.0 /100 | #305 | Tragic 16.8% |
| Immigrants | Caribbean | 0.0 /100 | #306 | Tragic 16.9% |
| Seminole | 0.0 /100 | #307 | Tragic 16.9% |
| Africans | 0.0 /100 | #308 | Tragic 16.9% |
| Immigrants | Mexico | 0.0 /100 | #309 | Tragic 17.0% |