Immigrants from Denmark vs Pakistani Married-Couple Family Poverty
COMPARE
Immigrants from Denmark
Pakistani
Married-Couple Family Poverty
Married-Couple Family Poverty Comparison
Immigrants from Denmark
Pakistanis
4.6%
MARRIED-COUPLE FAMILY POVERTY
98.8/ 100
METRIC RATING
83rd/ 347
METRIC RANK
4.7%
MARRIED-COUPLE FAMILY POVERTY
96.2/ 100
METRIC RATING
111th/ 347
METRIC RANK
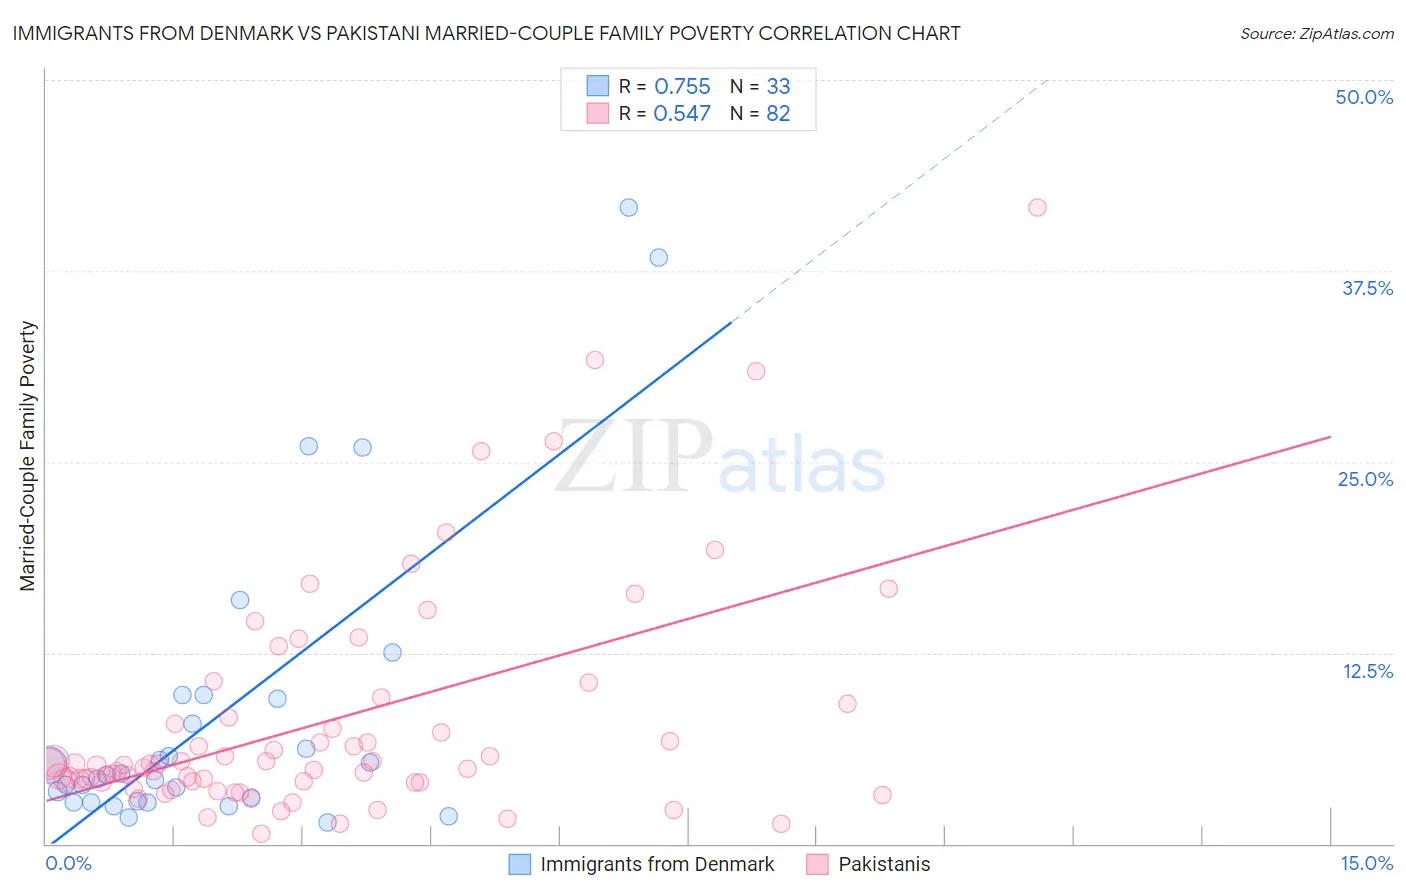
Immigrants from Denmark vs Pakistani Married-Couple Family Poverty Correlation Chart
The statistical analysis conducted on geographies consisting of 135,843,951 people shows a strong positive correlation between the proportion of Immigrants from Denmark and poverty level among married-couple families in the United States with a correlation coefficient (R) of 0.755 and weighted average of 4.6%. Similarly, the statistical analysis conducted on geographies consisting of 333,416,483 people shows a substantial positive correlation between the proportion of Pakistanis and poverty level among married-couple families in the United States with a correlation coefficient (R) of 0.547 and weighted average of 4.7%, a difference of 3.9%.
Married-Couple Family Poverty Correlation Summary
| Measurement | Immigrants from Denmark | Pakistani |
| Minimum | 1.4% | 0.63% |
| Maximum | 41.7% | 41.7% |
| Range | 40.3% | 41.0% |
| Mean | 8.5% | 7.9% |
| Median | 4.5% | 5.2% |
| Interquartile 25% (IQ1) | 2.8% | 4.0% |
| Interquartile 75% (IQ3) | 9.6% | 8.3% |
| Interquartile Range (IQR) | 6.8% | 4.3% |
| Standard Deviation (Sample) | 10.1% | 7.6% |
| Standard Deviation (Population) | 9.9% | 7.5% |
Similar Demographics by Married-Couple Family Poverty
Demographics Similar to Immigrants from Denmark by Married-Couple Family Poverty
In terms of married-couple family poverty, the demographic groups most similar to Immigrants from Denmark are Immigrants from Croatia (4.6%, a difference of 0.13%), Canadian (4.5%, a difference of 0.16%), South African (4.6%, a difference of 0.36%), Immigrants from Turkey (4.6%, a difference of 0.40%), and Immigrants from Greece (4.5%, a difference of 0.41%).
| Demographics | Rating | Rank | Married-Couple Family Poverty |
| Immigrants | South Africa | 99.1 /100 | #76 | Exceptional 4.5% |
| Immigrants | Latvia | 99.1 /100 | #77 | Exceptional 4.5% |
| Scotch-Irish | 99.1 /100 | #78 | Exceptional 4.5% |
| Immigrants | Iran | 99.0 /100 | #79 | Exceptional 4.5% |
| Icelanders | 99.0 /100 | #80 | Exceptional 4.5% |
| Immigrants | Greece | 98.9 /100 | #81 | Exceptional 4.5% |
| Canadians | 98.8 /100 | #82 | Exceptional 4.5% |
| Immigrants | Denmark | 98.8 /100 | #83 | Exceptional 4.6% |
| Immigrants | Croatia | 98.7 /100 | #84 | Exceptional 4.6% |
| South Africans | 98.7 /100 | #85 | Exceptional 4.6% |
| Immigrants | Turkey | 98.6 /100 | #86 | Exceptional 4.6% |
| Immigrants | North Macedonia | 98.6 /100 | #87 | Exceptional 4.6% |
| Bolivians | 98.6 /100 | #88 | Exceptional 4.6% |
| Immigrants | Czechoslovakia | 98.5 /100 | #89 | Exceptional 4.6% |
| Immigrants | Switzerland | 98.5 /100 | #90 | Exceptional 4.6% |
Demographics Similar to Pakistanis by Married-Couple Family Poverty
In terms of married-couple family poverty, the demographic groups most similar to Pakistanis are Immigrants from Bolivia (4.7%, a difference of 0.040%), Tongan (4.7%, a difference of 0.18%), Immigrants from Hong Kong (4.7%, a difference of 0.20%), Immigrants from Nepal (4.7%, a difference of 0.25%), and Laotian (4.7%, a difference of 0.40%).
| Demographics | Rating | Rank | Married-Couple Family Poverty |
| Immigrants | Moldova | 97.1 /100 | #104 | Exceptional 4.7% |
| Aleuts | 97.0 /100 | #105 | Exceptional 4.7% |
| Immigrants | France | 96.9 /100 | #106 | Exceptional 4.7% |
| Immigrants | Germany | 96.8 /100 | #107 | Exceptional 4.7% |
| Laotians | 96.6 /100 | #108 | Exceptional 4.7% |
| Immigrants | Hong Kong | 96.4 /100 | #109 | Exceptional 4.7% |
| Immigrants | Bolivia | 96.2 /100 | #110 | Exceptional 4.7% |
| Pakistanis | 96.2 /100 | #111 | Exceptional 4.7% |
| Tongans | 95.9 /100 | #112 | Exceptional 4.7% |
| Immigrants | Nepal | 95.9 /100 | #113 | Exceptional 4.7% |
| Immigrants | Indonesia | 95.1 /100 | #114 | Exceptional 4.8% |
| Taiwanese | 94.8 /100 | #115 | Exceptional 4.8% |
| Celtics | 94.8 /100 | #116 | Exceptional 4.8% |
| Kenyans | 94.7 /100 | #117 | Exceptional 4.8% |
| Immigrants | Philippines | 94.6 /100 | #118 | Exceptional 4.8% |