Luxembourger vs Immigrants from Denmark Poverty
COMPARE
Luxembourger
Immigrants from Denmark
Poverty
Poverty Comparison
Luxembourgers
Immigrants from Denmark
10.6%
POVERTY
99.7/ 100
METRIC RATING
21st/ 347
METRIC RANK
11.4%
POVERTY
95.5/ 100
METRIC RATING
90th/ 347
METRIC RANK
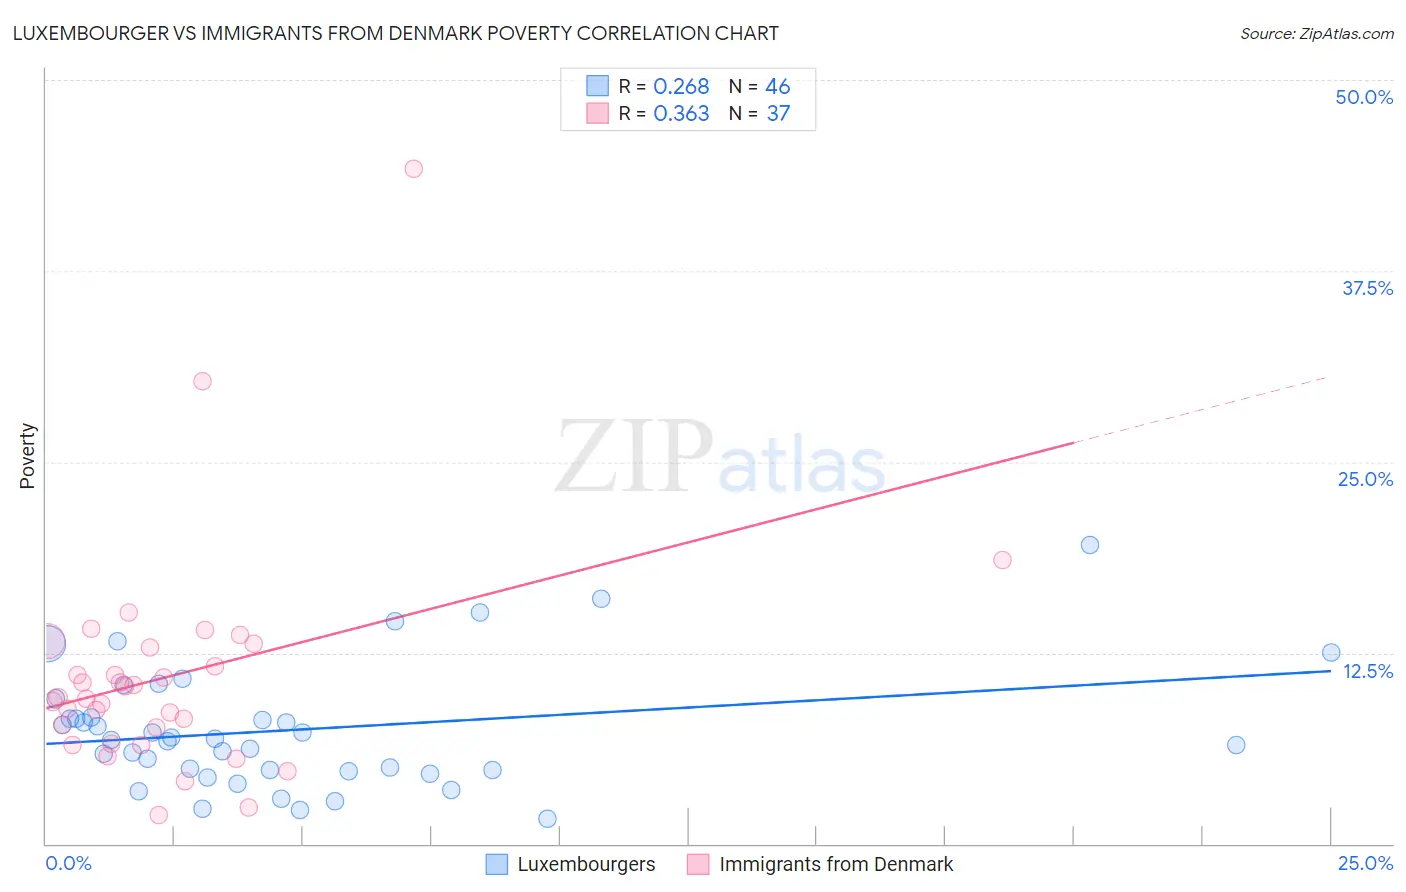
Luxembourger vs Immigrants from Denmark Poverty Correlation Chart
The statistical analysis conducted on geographies consisting of 144,648,044 people shows a weak positive correlation between the proportion of Luxembourgers and poverty level in the United States with a correlation coefficient (R) of 0.268 and weighted average of 10.6%. Similarly, the statistical analysis conducted on geographies consisting of 136,404,120 people shows a mild positive correlation between the proportion of Immigrants from Denmark and poverty level in the United States with a correlation coefficient (R) of 0.363 and weighted average of 11.4%, a difference of 7.8%.
Poverty Correlation Summary
| Measurement | Luxembourger | Immigrants from Denmark |
| Minimum | 1.6% | 1.9% |
| Maximum | 19.5% | 44.2% |
| Range | 17.9% | 42.3% |
| Mean | 7.5% | 11.0% |
| Median | 6.8% | 9.6% |
| Interquartile 25% (IQ1) | 4.8% | 7.1% |
| Interquartile 75% (IQ3) | 8.3% | 13.0% |
| Interquartile Range (IQR) | 3.5% | 5.9% |
| Standard Deviation (Sample) | 3.9% | 7.5% |
| Standard Deviation (Population) | 3.9% | 7.4% |
Similar Demographics by Poverty
Demographics Similar to Luxembourgers by Poverty
In terms of poverty, the demographic groups most similar to Luxembourgers are Immigrants from North Macedonia (10.6%, a difference of 0.080%), Eastern European (10.6%, a difference of 0.16%), Immigrants from Scotland (10.6%, a difference of 0.19%), Swedish (10.6%, a difference of 0.27%), and Italian (10.6%, a difference of 0.31%).
| Demographics | Rating | Rank | Poverty |
| Immigrants | Bolivia | 99.8 /100 | #14 | Exceptional 10.4% |
| Bolivians | 99.8 /100 | #15 | Exceptional 10.4% |
| Lithuanians | 99.8 /100 | #16 | Exceptional 10.5% |
| Norwegians | 99.8 /100 | #17 | Exceptional 10.5% |
| Latvians | 99.8 /100 | #18 | Exceptional 10.5% |
| Immigrants | Scotland | 99.7 /100 | #19 | Exceptional 10.6% |
| Immigrants | North Macedonia | 99.7 /100 | #20 | Exceptional 10.6% |
| Luxembourgers | 99.7 /100 | #21 | Exceptional 10.6% |
| Eastern Europeans | 99.7 /100 | #22 | Exceptional 10.6% |
| Swedes | 99.7 /100 | #23 | Exceptional 10.6% |
| Italians | 99.7 /100 | #24 | Exceptional 10.6% |
| Croatians | 99.6 /100 | #25 | Exceptional 10.6% |
| Burmese | 99.6 /100 | #26 | Exceptional 10.7% |
| Immigrants | Northern Europe | 99.6 /100 | #27 | Exceptional 10.7% |
| Immigrants | Korea | 99.5 /100 | #28 | Exceptional 10.7% |
Demographics Similar to Immigrants from Denmark by Poverty
In terms of poverty, the demographic groups most similar to Immigrants from Denmark are Finnish (11.4%, a difference of 0.13%), Czechoslovakian (11.4%, a difference of 0.17%), Belgian (11.4%, a difference of 0.20%), British (11.4%, a difference of 0.27%), and Romanian (11.4%, a difference of 0.31%).
| Demographics | Rating | Rank | Poverty |
| Immigrants | Sweden | 96.3 /100 | #83 | Exceptional 11.3% |
| English | 96.3 /100 | #84 | Exceptional 11.3% |
| Immigrants | England | 96.2 /100 | #85 | Exceptional 11.4% |
| Jordanians | 96.0 /100 | #86 | Exceptional 11.4% |
| Northern Europeans | 96.0 /100 | #87 | Exceptional 11.4% |
| Belgians | 95.8 /100 | #88 | Exceptional 11.4% |
| Czechoslovakians | 95.7 /100 | #89 | Exceptional 11.4% |
| Immigrants | Denmark | 95.5 /100 | #90 | Exceptional 11.4% |
| Finns | 95.2 /100 | #91 | Exceptional 11.4% |
| British | 95.0 /100 | #92 | Exceptional 11.4% |
| Romanians | 94.9 /100 | #93 | Exceptional 11.4% |
| Paraguayans | 94.9 /100 | #94 | Exceptional 11.4% |
| Australians | 94.9 /100 | #95 | Exceptional 11.4% |
| Immigrants | South Africa | 94.7 /100 | #96 | Exceptional 11.5% |
| Immigrants | Egypt | 94.6 /100 | #97 | Exceptional 11.5% |