Paiute vs Immigrants from South Eastern Asia Married-Couple Family Poverty
COMPARE
Paiute
Immigrants from South Eastern Asia
Married-Couple Family Poverty
Married-Couple Family Poverty Comparison
Paiute
Immigrants from South Eastern Asia
8.3%
MARRIED-COUPLE FAMILY POVERTY
0.0/ 100
METRIC RATING
330th/ 347
METRIC RANK
5.1%
MARRIED-COUPLE FAMILY POVERTY
70.4/ 100
METRIC RATING
158th/ 347
METRIC RANK
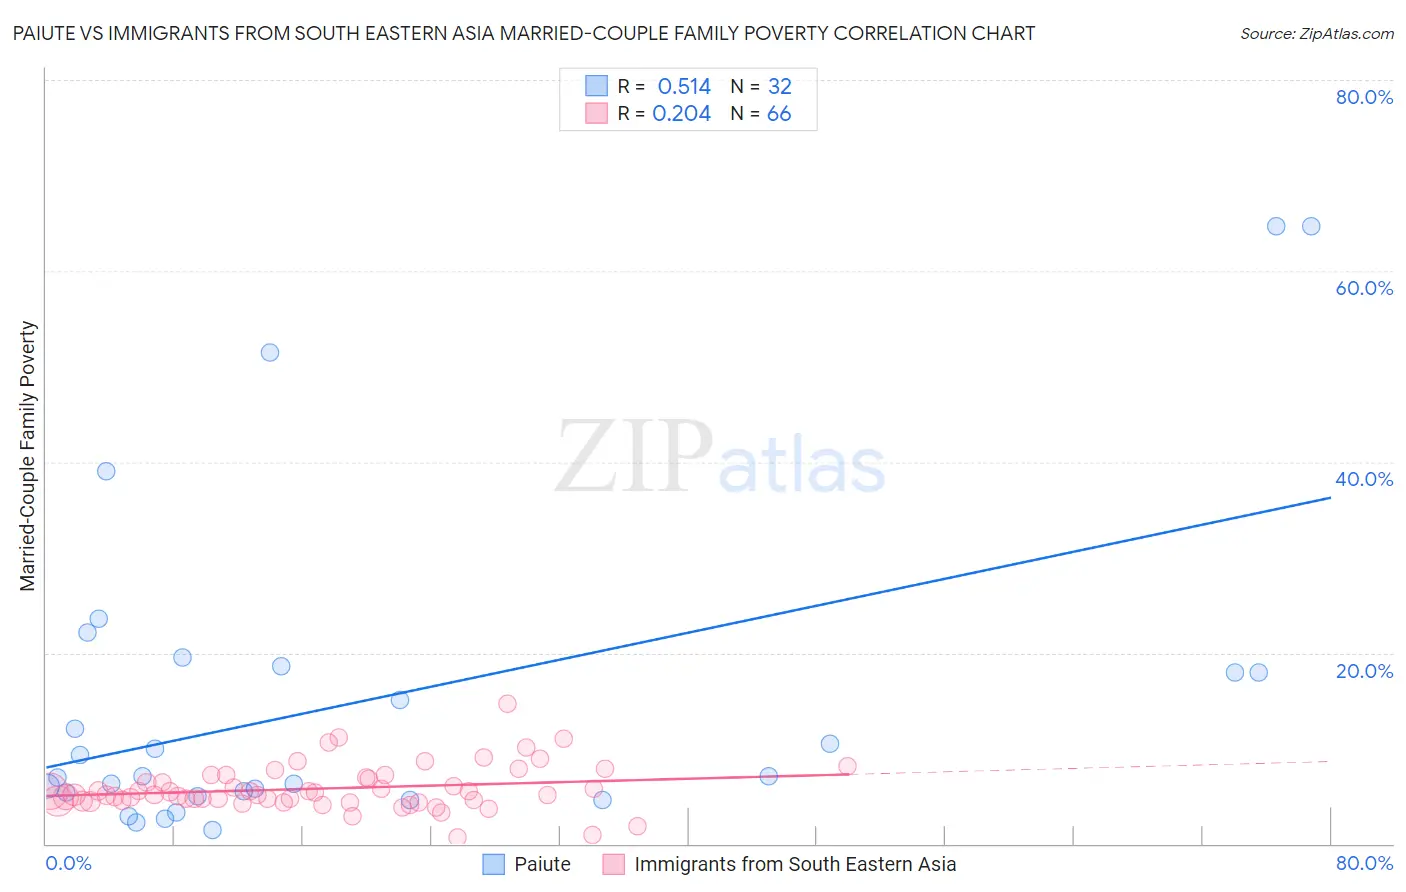
Paiute vs Immigrants from South Eastern Asia Married-Couple Family Poverty Correlation Chart
The statistical analysis conducted on geographies consisting of 58,284,978 people shows a substantial positive correlation between the proportion of Paiute and poverty level among married-couple families in the United States with a correlation coefficient (R) of 0.514 and weighted average of 8.3%. Similarly, the statistical analysis conducted on geographies consisting of 504,926,469 people shows a weak positive correlation between the proportion of Immigrants from South Eastern Asia and poverty level among married-couple families in the United States with a correlation coefficient (R) of 0.204 and weighted average of 5.1%, a difference of 63.0%.
Married-Couple Family Poverty Correlation Summary
| Measurement | Paiute | Immigrants from South Eastern Asia |
| Minimum | 1.5% | 0.63% |
| Maximum | 64.7% | 14.6% |
| Range | 63.3% | 14.0% |
| Mean | 15.0% | 5.8% |
| Median | 7.1% | 5.1% |
| Interquartile 25% (IQ1) | 5.2% | 4.5% |
| Interquartile 75% (IQ3) | 18.3% | 6.9% |
| Interquartile Range (IQR) | 13.1% | 2.4% |
| Standard Deviation (Sample) | 16.9% | 2.4% |
| Standard Deviation (Population) | 16.7% | 2.4% |
Similar Demographics by Married-Couple Family Poverty
Demographics Similar to Paiute by Married-Couple Family Poverty
In terms of married-couple family poverty, the demographic groups most similar to Paiute are Central American Indian (8.3%, a difference of 0.060%), Dominican (8.3%, a difference of 0.12%), Lumbee (8.3%, a difference of 0.59%), Native/Alaskan (8.2%, a difference of 1.3%), and Immigrants from Dominican Republic (8.4%, a difference of 1.3%).
| Demographics | Rating | Rank | Married-Couple Family Poverty |
| Vietnamese | 0.0 /100 | #323 | Tragic 7.4% |
| Immigrants | Central America | 0.0 /100 | #324 | Tragic 7.4% |
| Immigrants | Cuba | 0.0 /100 | #325 | Tragic 7.5% |
| Immigrants | Bangladesh | 0.0 /100 | #326 | Tragic 7.5% |
| Hispanics or Latinos | 0.0 /100 | #327 | Tragic 7.5% |
| Immigrants | Mexico | 0.0 /100 | #328 | Tragic 7.6% |
| Natives/Alaskans | 0.0 /100 | #329 | Tragic 8.2% |
| Paiute | 0.0 /100 | #330 | Tragic 8.3% |
| Central American Indians | 0.0 /100 | #331 | Tragic 8.3% |
| Dominicans | 0.0 /100 | #332 | Tragic 8.3% |
| Lumbee | 0.0 /100 | #333 | Tragic 8.3% |
| Immigrants | Dominican Republic | 0.0 /100 | #334 | Tragic 8.4% |
| Sioux | 0.0 /100 | #335 | Tragic 8.7% |
| Apache | 0.0 /100 | #336 | Tragic 9.0% |
| Yakama | 0.0 /100 | #337 | Tragic 9.0% |
Demographics Similar to Immigrants from South Eastern Asia by Married-Couple Family Poverty
In terms of married-couple family poverty, the demographic groups most similar to Immigrants from South Eastern Asia are Immigrants from Saudi Arabia (5.1%, a difference of 0.0%), Argentinean (5.1%, a difference of 0.050%), Pennsylvania German (5.1%, a difference of 0.26%), Sri Lankan (5.1%, a difference of 0.27%), and Immigrants from Ethiopia (5.1%, a difference of 0.31%).
| Demographics | Rating | Rank | Married-Couple Family Poverty |
| Immigrants | Cameroon | 77.3 /100 | #151 | Good 5.0% |
| Albanians | 77.2 /100 | #152 | Good 5.0% |
| Immigrants | Kuwait | 76.3 /100 | #153 | Good 5.0% |
| Delaware | 73.7 /100 | #154 | Good 5.1% |
| Immigrants | Ethiopia | 72.4 /100 | #155 | Good 5.1% |
| Sri Lankans | 72.2 /100 | #156 | Good 5.1% |
| Argentineans | 70.7 /100 | #157 | Good 5.1% |
| Immigrants | South Eastern Asia | 70.4 /100 | #158 | Good 5.1% |
| Immigrants | Saudi Arabia | 70.3 /100 | #159 | Good 5.1% |
| Pennsylvania Germans | 68.5 /100 | #160 | Good 5.1% |
| Ethiopians | 68.1 /100 | #161 | Good 5.1% |
| Immigrants | Jordan | 66.5 /100 | #162 | Good 5.1% |
| Sierra Leoneans | 64.1 /100 | #163 | Good 5.1% |
| Hawaiians | 62.3 /100 | #164 | Good 5.1% |
| Immigrants | Malaysia | 62.2 /100 | #165 | Good 5.1% |