Potawatomi vs Czech Child Poverty Under the Age of 16
COMPARE
Potawatomi
Czech
Child Poverty Under the Age of 16
Child Poverty Under the Age of 16 Comparison
Potawatomi
Czechs
19.0%
CHILD POVERTY UNDER THE AGE OF 16
0.3/ 100
METRIC RATING
249th/ 347
METRIC RANK
13.8%
CHILD POVERTY UNDER THE AGE OF 16
99.3/ 100
METRIC RATING
45th/ 347
METRIC RANK
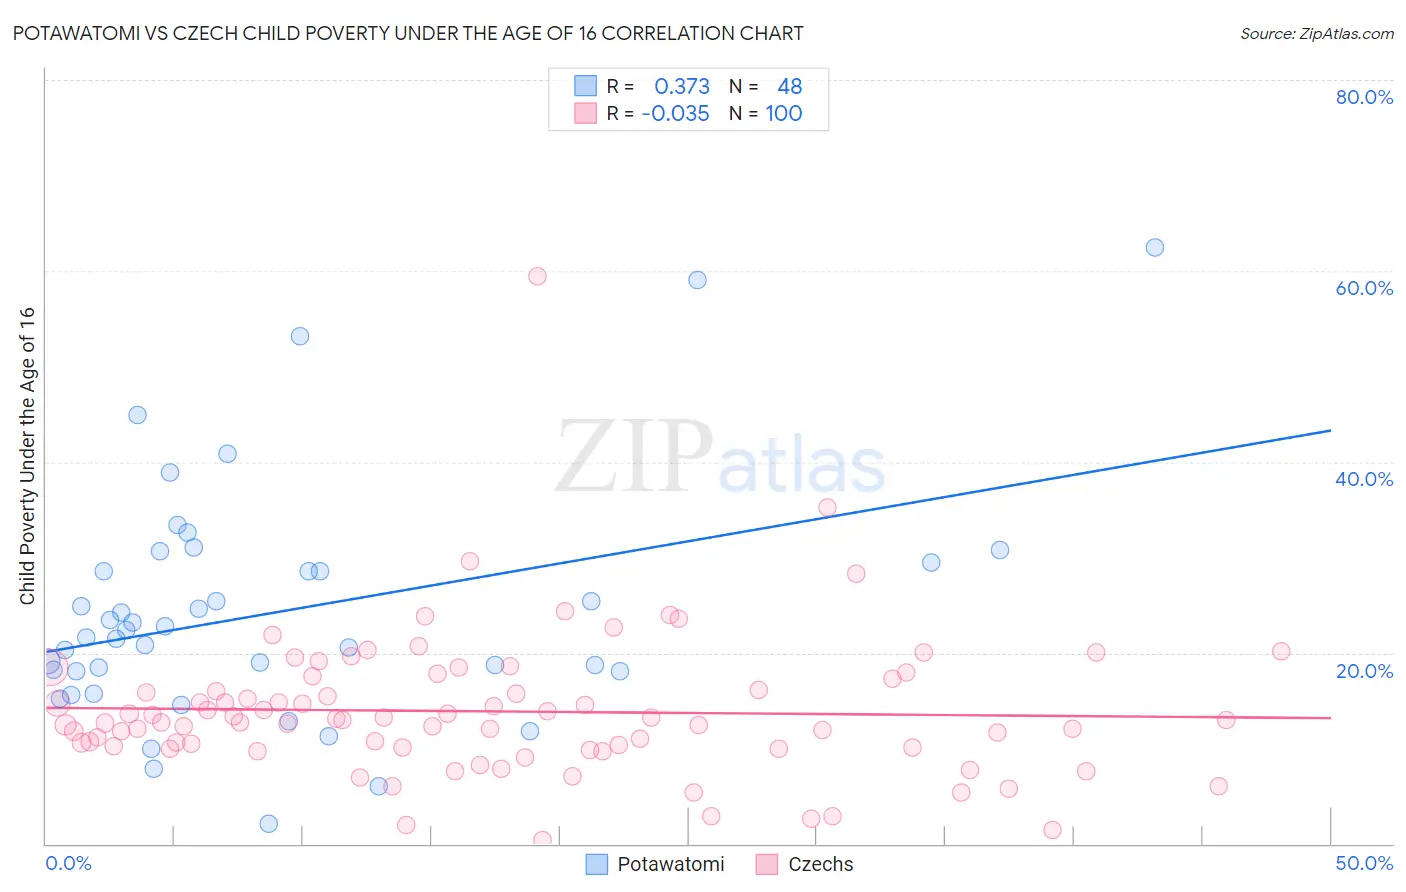
Potawatomi vs Czech Child Poverty Under the Age of 16 Correlation Chart
The statistical analysis conducted on geographies consisting of 117,473,680 people shows a mild positive correlation between the proportion of Potawatomi and poverty level among children under the age of 16 in the United States with a correlation coefficient (R) of 0.373 and weighted average of 19.0%. Similarly, the statistical analysis conducted on geographies consisting of 477,035,895 people shows no correlation between the proportion of Czechs and poverty level among children under the age of 16 in the United States with a correlation coefficient (R) of -0.035 and weighted average of 13.8%, a difference of 37.6%.
Child Poverty Under the Age of 16 Correlation Summary
| Measurement | Potawatomi | Czech |
| Minimum | 2.0% | 0.42% |
| Maximum | 62.5% | 59.4% |
| Range | 60.5% | 59.0% |
| Mean | 24.3% | 13.9% |
| Median | 21.9% | 12.8% |
| Interquartile 25% (IQ1) | 18.1% | 10.1% |
| Interquartile 75% (IQ3) | 29.0% | 16.7% |
| Interquartile Range (IQR) | 10.9% | 6.7% |
| Standard Deviation (Sample) | 12.4% | 7.6% |
| Standard Deviation (Population) | 12.2% | 7.6% |
Similar Demographics by Child Poverty Under the Age of 16
Demographics Similar to Potawatomi by Child Poverty Under the Age of 16
In terms of child poverty under the age of 16, the demographic groups most similar to Potawatomi are Ecuadorian (19.0%, a difference of 0.19%), Immigrants from Middle Africa (19.0%, a difference of 0.20%), Immigrants from Ghana (19.1%, a difference of 0.36%), Immigrants from Trinidad and Tobago (19.1%, a difference of 0.43%), and French American Indian (18.9%, a difference of 0.61%).
| Demographics | Rating | Rank | Child Poverty Under the Age of 16 |
| Immigrants | Laos | 0.6 /100 | #242 | Tragic 18.7% |
| Immigrants | Cuba | 0.6 /100 | #243 | Tragic 18.7% |
| Cape Verdeans | 0.6 /100 | #244 | Tragic 18.7% |
| Shoshone | 0.5 /100 | #245 | Tragic 18.8% |
| Immigrants | Nicaragua | 0.4 /100 | #246 | Tragic 18.8% |
| French American Indians | 0.4 /100 | #247 | Tragic 18.9% |
| Ecuadorians | 0.3 /100 | #248 | Tragic 19.0% |
| Potawatomi | 0.3 /100 | #249 | Tragic 19.0% |
| Immigrants | Middle Africa | 0.3 /100 | #250 | Tragic 19.0% |
| Immigrants | Ghana | 0.3 /100 | #251 | Tragic 19.1% |
| Immigrants | Trinidad and Tobago | 0.3 /100 | #252 | Tragic 19.1% |
| Salvadorans | 0.3 /100 | #253 | Tragic 19.1% |
| Immigrants | Western Africa | 0.2 /100 | #254 | Tragic 19.2% |
| Trinidadians and Tobagonians | 0.2 /100 | #255 | Tragic 19.2% |
| Inupiat | 0.2 /100 | #256 | Tragic 19.2% |
Demographics Similar to Czechs by Child Poverty Under the Age of 16
In terms of child poverty under the age of 16, the demographic groups most similar to Czechs are Greek (13.8%, a difference of 0.050%), Immigrants from Moldova (13.8%, a difference of 0.22%), Immigrants from Sri Lanka (13.8%, a difference of 0.29%), Immigrants from Asia (13.8%, a difference of 0.29%), and Croatian (13.8%, a difference of 0.37%).
| Demographics | Rating | Rank | Child Poverty Under the Age of 16 |
| Luxembourgers | 99.5 /100 | #38 | Exceptional 13.6% |
| Immigrants | Australia | 99.5 /100 | #39 | Exceptional 13.6% |
| Immigrants | Scotland | 99.4 /100 | #40 | Exceptional 13.7% |
| Croatians | 99.4 /100 | #41 | Exceptional 13.8% |
| Immigrants | Sri Lanka | 99.3 /100 | #42 | Exceptional 13.8% |
| Immigrants | Moldova | 99.3 /100 | #43 | Exceptional 13.8% |
| Greeks | 99.3 /100 | #44 | Exceptional 13.8% |
| Czechs | 99.3 /100 | #45 | Exceptional 13.8% |
| Immigrants | Asia | 99.2 /100 | #46 | Exceptional 13.8% |
| Estonians | 99.2 /100 | #47 | Exceptional 13.9% |
| Koreans | 99.2 /100 | #48 | Exceptional 13.9% |
| Italians | 99.2 /100 | #49 | Exceptional 13.9% |
| Immigrants | Czechoslovakia | 99.1 /100 | #50 | Exceptional 13.9% |
| Immigrants | Greece | 99.1 /100 | #51 | Exceptional 13.9% |
| Poles | 98.9 /100 | #52 | Exceptional 14.0% |