Potawatomi vs South American Indian Child Poverty Under the Age of 16
COMPARE
Potawatomi
South American Indian
Child Poverty Under the Age of 16
Child Poverty Under the Age of 16 Comparison
Potawatomi
South American Indians
19.0%
CHILD POVERTY UNDER THE AGE OF 16
0.3/ 100
METRIC RATING
249th/ 347
METRIC RANK
16.4%
CHILD POVERTY UNDER THE AGE OF 16
41.8/ 100
METRIC RATING
180th/ 347
METRIC RANK
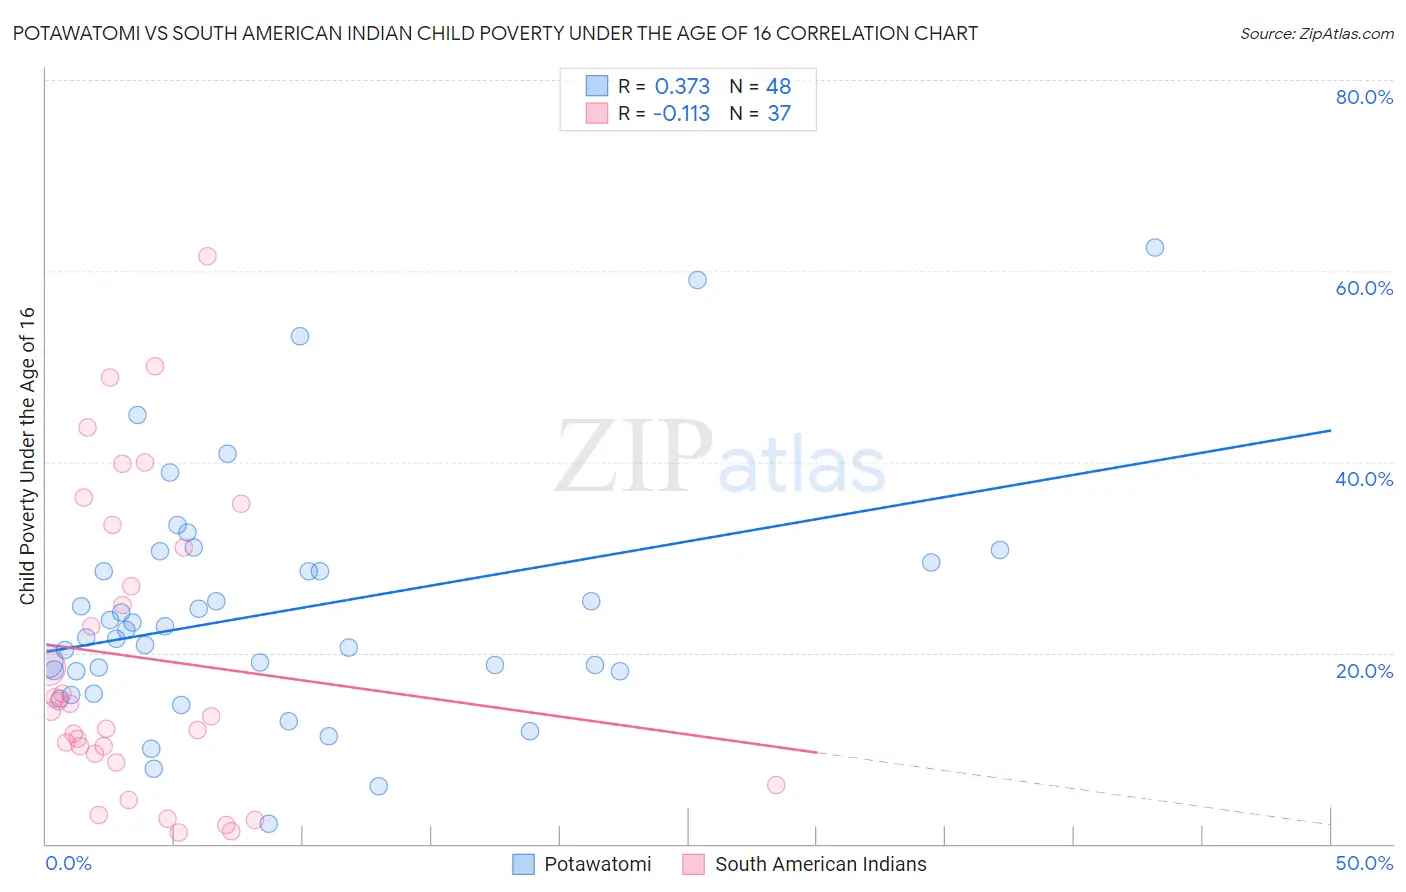
Potawatomi vs South American Indian Child Poverty Under the Age of 16 Correlation Chart
The statistical analysis conducted on geographies consisting of 117,473,680 people shows a mild positive correlation between the proportion of Potawatomi and poverty level among children under the age of 16 in the United States with a correlation coefficient (R) of 0.373 and weighted average of 19.0%. Similarly, the statistical analysis conducted on geographies consisting of 164,199,892 people shows a poor negative correlation between the proportion of South American Indians and poverty level among children under the age of 16 in the United States with a correlation coefficient (R) of -0.113 and weighted average of 16.4%, a difference of 16.1%.
Child Poverty Under the Age of 16 Correlation Summary
| Measurement | Potawatomi | South American Indian |
| Minimum | 2.0% | 1.2% |
| Maximum | 62.5% | 61.5% |
| Range | 60.5% | 60.3% |
| Mean | 24.3% | 19.4% |
| Median | 21.9% | 13.9% |
| Interquartile 25% (IQ1) | 18.1% | 9.0% |
| Interquartile 75% (IQ3) | 29.0% | 32.2% |
| Interquartile Range (IQR) | 10.9% | 23.2% |
| Standard Deviation (Sample) | 12.4% | 15.8% |
| Standard Deviation (Population) | 12.2% | 15.6% |
Similar Demographics by Child Poverty Under the Age of 16
Demographics Similar to Potawatomi by Child Poverty Under the Age of 16
In terms of child poverty under the age of 16, the demographic groups most similar to Potawatomi are Ecuadorian (19.0%, a difference of 0.19%), Immigrants from Middle Africa (19.0%, a difference of 0.20%), Immigrants from Ghana (19.1%, a difference of 0.36%), Immigrants from Trinidad and Tobago (19.1%, a difference of 0.43%), and French American Indian (18.9%, a difference of 0.61%).
| Demographics | Rating | Rank | Child Poverty Under the Age of 16 |
| Immigrants | Laos | 0.6 /100 | #242 | Tragic 18.7% |
| Immigrants | Cuba | 0.6 /100 | #243 | Tragic 18.7% |
| Cape Verdeans | 0.6 /100 | #244 | Tragic 18.7% |
| Shoshone | 0.5 /100 | #245 | Tragic 18.8% |
| Immigrants | Nicaragua | 0.4 /100 | #246 | Tragic 18.8% |
| French American Indians | 0.4 /100 | #247 | Tragic 18.9% |
| Ecuadorians | 0.3 /100 | #248 | Tragic 19.0% |
| Potawatomi | 0.3 /100 | #249 | Tragic 19.0% |
| Immigrants | Middle Africa | 0.3 /100 | #250 | Tragic 19.0% |
| Immigrants | Ghana | 0.3 /100 | #251 | Tragic 19.1% |
| Immigrants | Trinidad and Tobago | 0.3 /100 | #252 | Tragic 19.1% |
| Salvadorans | 0.3 /100 | #253 | Tragic 19.1% |
| Immigrants | Western Africa | 0.2 /100 | #254 | Tragic 19.2% |
| Trinidadians and Tobagonians | 0.2 /100 | #255 | Tragic 19.2% |
| Inupiat | 0.2 /100 | #256 | Tragic 19.2% |
Demographics Similar to South American Indians by Child Poverty Under the Age of 16
In terms of child poverty under the age of 16, the demographic groups most similar to South American Indians are Immigrants from Syria (16.4%, a difference of 0.050%), Immigrants from Ethiopia (16.4%, a difference of 0.060%), Immigrants from South America (16.4%, a difference of 0.12%), Ethiopian (16.3%, a difference of 0.19%), and Hawaiian (16.4%, a difference of 0.45%).
| Demographics | Rating | Rank | Child Poverty Under the Age of 16 |
| Immigrants | Saudi Arabia | 52.1 /100 | #173 | Average 16.2% |
| Whites/Caucasians | 50.0 /100 | #174 | Average 16.2% |
| Scotch-Irish | 47.1 /100 | #175 | Average 16.3% |
| Lebanese | 45.9 /100 | #176 | Average 16.3% |
| Ethiopians | 43.4 /100 | #177 | Average 16.3% |
| Immigrants | Ethiopia | 42.3 /100 | #178 | Average 16.4% |
| Immigrants | Syria | 42.3 /100 | #179 | Average 16.4% |
| South American Indians | 41.8 /100 | #180 | Average 16.4% |
| Immigrants | South America | 40.8 /100 | #181 | Average 16.4% |
| Hawaiians | 38.2 /100 | #182 | Fair 16.4% |
| Celtics | 38.2 /100 | #183 | Fair 16.4% |
| Immigrants | Western Asia | 38.0 /100 | #184 | Fair 16.4% |
| Immigrants | Bosnia and Herzegovina | 37.4 /100 | #185 | Fair 16.5% |
| Kenyans | 34.1 /100 | #186 | Fair 16.5% |
| Arabs | 31.4 /100 | #187 | Fair 16.6% |