Turkish vs Albanian Female Poverty Among 18-24 Year Olds
COMPARE
Turkish
Albanian
Female Poverty Among 18-24 Year Olds
Female Poverty Among 18-24 Year Olds Comparison
Turks
Albanians
19.5%
FEMALE POVERTY AMONG 18-24 YEAR OLDS
92.1/ 100
METRIC RATING
133rd/ 347
METRIC RANK
18.4%
FEMALE POVERTY AMONG 18-24 YEAR OLDS
99.9/ 100
METRIC RATING
55th/ 347
METRIC RANK
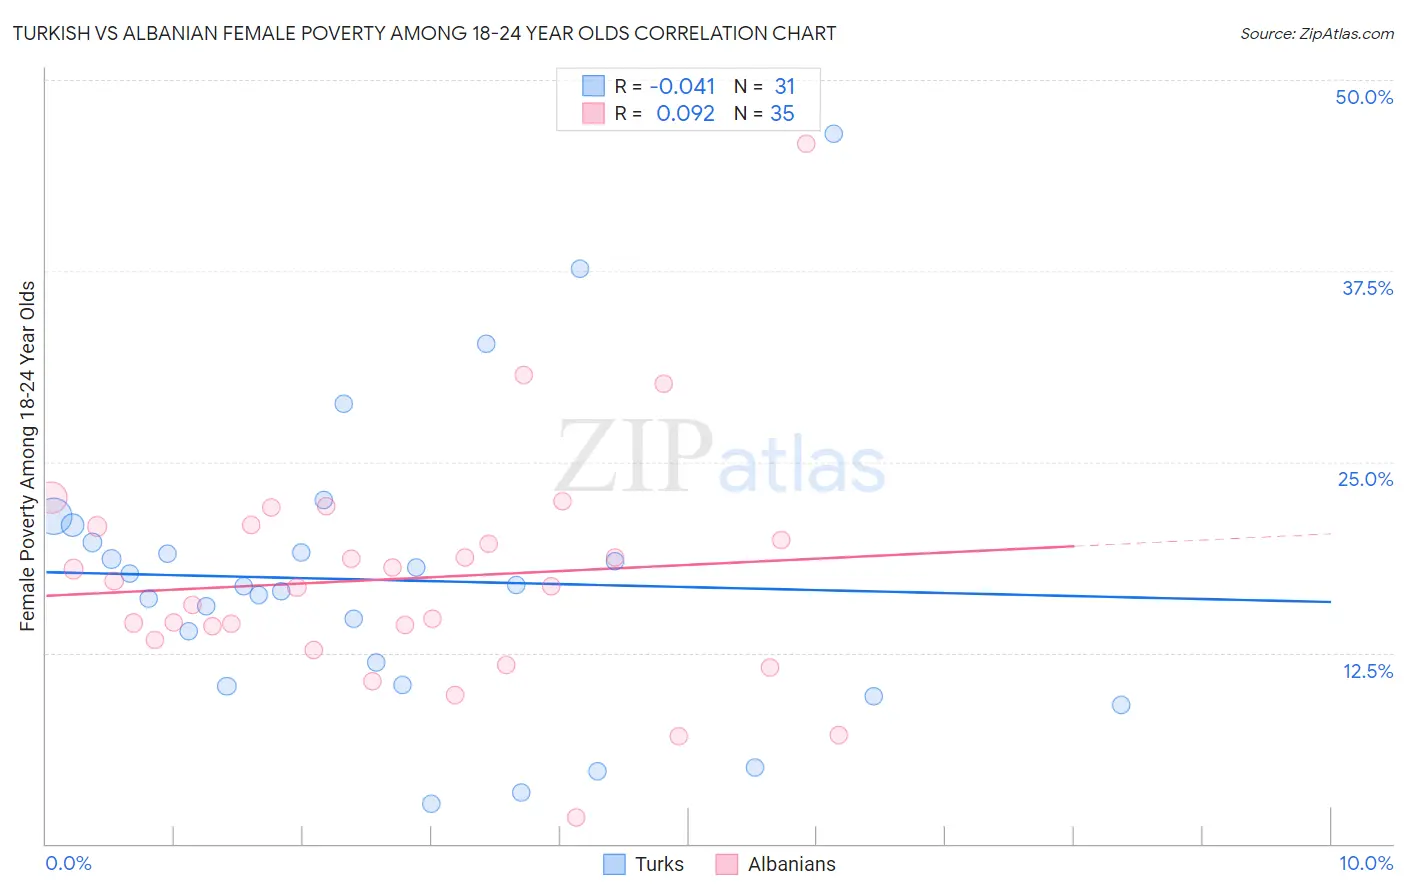
Turkish vs Albanian Female Poverty Among 18-24 Year Olds Correlation Chart
The statistical analysis conducted on geographies consisting of 266,666,868 people shows no correlation between the proportion of Turks and poverty level among females between the ages 18 and 24 in the United States with a correlation coefficient (R) of -0.041 and weighted average of 19.5%. Similarly, the statistical analysis conducted on geographies consisting of 189,512,996 people shows a slight positive correlation between the proportion of Albanians and poverty level among females between the ages 18 and 24 in the United States with a correlation coefficient (R) of 0.092 and weighted average of 18.4%, a difference of 6.1%.
Female Poverty Among 18-24 Year Olds Correlation Summary
| Measurement | Turkish | Albanian |
| Minimum | 2.6% | 1.7% |
| Maximum | 46.5% | 45.8% |
| Range | 43.9% | 44.1% |
| Mean | 17.3% | 17.4% |
| Median | 16.9% | 16.9% |
| Interquartile 25% (IQ1) | 10.4% | 13.3% |
| Interquartile 75% (IQ3) | 19.7% | 20.8% |
| Interquartile Range (IQR) | 9.3% | 7.4% |
| Standard Deviation (Sample) | 9.5% | 7.7% |
| Standard Deviation (Population) | 9.3% | 7.6% |
Similar Demographics by Female Poverty Among 18-24 Year Olds
Demographics Similar to Turks by Female Poverty Among 18-24 Year Olds
In terms of female poverty among 18-24 year olds, the demographic groups most similar to Turks are Jamaican (19.5%, a difference of 0.0%), Immigrants from North America (19.5%, a difference of 0.010%), Soviet Union (19.5%, a difference of 0.020%), Latvian (19.5%, a difference of 0.11%), and Russian (19.5%, a difference of 0.11%).
| Demographics | Rating | Rank | Female Poverty Among 18-24 Year Olds |
| Immigrants | Russia | 93.7 /100 | #126 | Exceptional 19.4% |
| Cape Verdeans | 93.6 /100 | #127 | Exceptional 19.4% |
| Slovaks | 92.9 /100 | #128 | Exceptional 19.5% |
| Immigrants | England | 92.9 /100 | #129 | Exceptional 19.5% |
| Immigrants | Canada | 92.9 /100 | #130 | Exceptional 19.5% |
| Latvians | 92.7 /100 | #131 | Exceptional 19.5% |
| Jamaicans | 92.1 /100 | #132 | Exceptional 19.5% |
| Turks | 92.1 /100 | #133 | Exceptional 19.5% |
| Immigrants | North America | 92.1 /100 | #134 | Exceptional 19.5% |
| Soviet Union | 92.0 /100 | #135 | Exceptional 19.5% |
| Russians | 91.5 /100 | #136 | Exceptional 19.5% |
| Austrians | 90.7 /100 | #137 | Exceptional 19.5% |
| Immigrants | Morocco | 89.9 /100 | #138 | Excellent 19.6% |
| Indians (Asian) | 88.3 /100 | #139 | Excellent 19.6% |
| Immigrants | Trinidad and Tobago | 85.6 /100 | #140 | Excellent 19.7% |
Demographics Similar to Albanians by Female Poverty Among 18-24 Year Olds
In terms of female poverty among 18-24 year olds, the demographic groups most similar to Albanians are Immigrants from Egypt (18.4%, a difference of 0.010%), Argentinean (18.4%, a difference of 0.020%), Immigrants from Italy (18.4%, a difference of 0.12%), Immigrants from Ukraine (18.4%, a difference of 0.18%), and Italian (18.3%, a difference of 0.23%).
| Demographics | Rating | Rank | Female Poverty Among 18-24 Year Olds |
| Sri Lankans | 100.0 /100 | #48 | Exceptional 18.2% |
| Bhutanese | 100.0 /100 | #49 | Exceptional 18.2% |
| Samoans | 100.0 /100 | #50 | Exceptional 18.2% |
| Immigrants | Eastern Europe | 99.9 /100 | #51 | Exceptional 18.2% |
| Immigrants | Ireland | 99.9 /100 | #52 | Exceptional 18.3% |
| Italians | 99.9 /100 | #53 | Exceptional 18.3% |
| Immigrants | Egypt | 99.9 /100 | #54 | Exceptional 18.4% |
| Albanians | 99.9 /100 | #55 | Exceptional 18.4% |
| Argentineans | 99.9 /100 | #56 | Exceptional 18.4% |
| Immigrants | Italy | 99.9 /100 | #57 | Exceptional 18.4% |
| Immigrants | Ukraine | 99.9 /100 | #58 | Exceptional 18.4% |
| Egyptians | 99.9 /100 | #59 | Exceptional 18.5% |
| Immigrants | Brazil | 99.8 /100 | #60 | Exceptional 18.5% |
| Immigrants | Albania | 99.8 /100 | #61 | Exceptional 18.5% |
| Greeks | 99.8 /100 | #62 | Exceptional 18.5% |