Yuman vs Spaniard Married-Couple Family Poverty
COMPARE
Yuman
Spaniard
Married-Couple Family Poverty
Married-Couple Family Poverty Comparison
Yuman
Spaniards
9.7%
MARRIED-COUPLE FAMILY POVERTY
0.0/ 100
METRIC RATING
340th/ 347
METRIC RANK
5.4%
MARRIED-COUPLE FAMILY POVERTY
27.4/ 100
METRIC RATING
196th/ 347
METRIC RANK
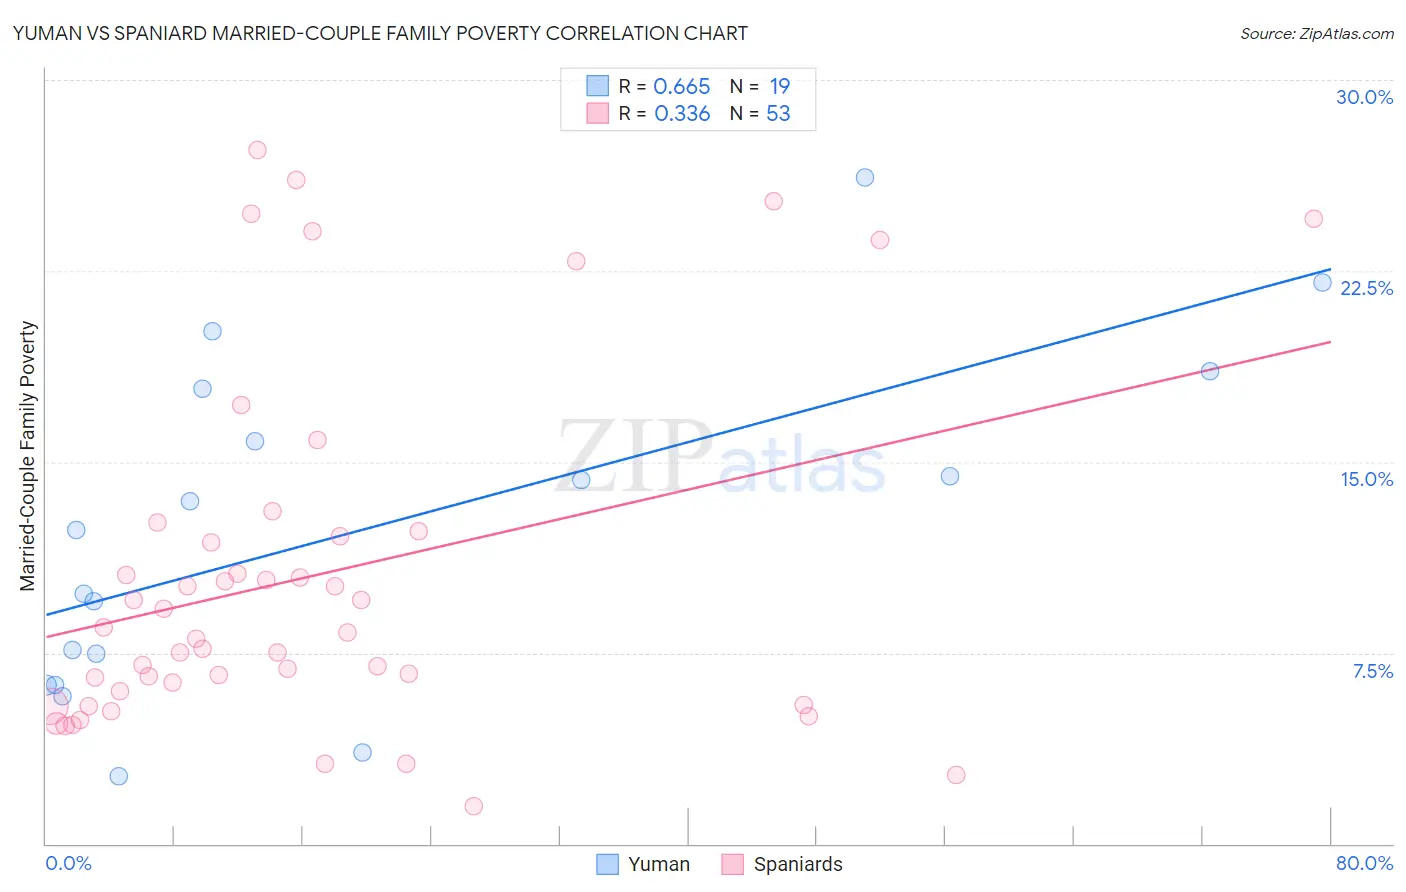
Yuman vs Spaniard Married-Couple Family Poverty Correlation Chart
The statistical analysis conducted on geographies consisting of 40,644,577 people shows a significant positive correlation between the proportion of Yuman and poverty level among married-couple families in the United States with a correlation coefficient (R) of 0.665 and weighted average of 9.7%. Similarly, the statistical analysis conducted on geographies consisting of 439,020,295 people shows a mild positive correlation between the proportion of Spaniards and poverty level among married-couple families in the United States with a correlation coefficient (R) of 0.336 and weighted average of 5.4%, a difference of 81.4%.
Married-Couple Family Poverty Correlation Summary
| Measurement | Yuman | Spaniard |
| Minimum | 2.7% | 1.5% |
| Maximum | 26.2% | 27.3% |
| Range | 23.5% | 25.8% |
| Mean | 12.3% | 10.5% |
| Median | 12.3% | 8.3% |
| Interquartile 25% (IQ1) | 6.2% | 5.7% |
| Interquartile 75% (IQ3) | 17.9% | 12.2% |
| Interquartile Range (IQR) | 11.6% | 6.5% |
| Standard Deviation (Sample) | 6.6% | 6.9% |
| Standard Deviation (Population) | 6.4% | 6.8% |
Similar Demographics by Married-Couple Family Poverty
Demographics Similar to Yuman by Married-Couple Family Poverty
In terms of married-couple family poverty, the demographic groups most similar to Yuman are Crow (9.6%, a difference of 1.8%), Cheyenne (9.4%, a difference of 3.2%), Yakama (9.0%, a difference of 8.7%), Apache (9.0%, a difference of 8.7%), and Sioux (8.7%, a difference of 11.9%).
| Demographics | Rating | Rank | Married-Couple Family Poverty |
| Lumbee | 0.0 /100 | #333 | Tragic 8.3% |
| Immigrants | Dominican Republic | 0.0 /100 | #334 | Tragic 8.4% |
| Sioux | 0.0 /100 | #335 | Tragic 8.7% |
| Apache | 0.0 /100 | #336 | Tragic 9.0% |
| Yakama | 0.0 /100 | #337 | Tragic 9.0% |
| Cheyenne | 0.0 /100 | #338 | Tragic 9.4% |
| Crow | 0.0 /100 | #339 | Tragic 9.6% |
| Yuman | 0.0 /100 | #340 | Tragic 9.7% |
| Pueblo | 0.0 /100 | #341 | Tragic 11.1% |
| Tohono O'odham | 0.0 /100 | #342 | Tragic 11.2% |
| Pima | 0.0 /100 | #343 | Tragic 11.4% |
| Navajo | 0.0 /100 | #344 | Tragic 11.9% |
| Puerto Ricans | 0.0 /100 | #345 | Tragic 12.6% |
| Immigrants | Yemen | 0.0 /100 | #346 | Tragic 12.8% |
| Yup'ik | 0.0 /100 | #347 | Tragic 13.4% |
Demographics Similar to Spaniards by Married-Couple Family Poverty
In terms of married-couple family poverty, the demographic groups most similar to Spaniards are Immigrants from the Azores (5.4%, a difference of 0.020%), Immigrants from Israel (5.4%, a difference of 0.060%), Liberian (5.4%, a difference of 0.15%), Immigrants from Belarus (5.4%, a difference of 0.18%), and Malaysian (5.4%, a difference of 0.29%).
| Demographics | Rating | Rank | Married-Couple Family Poverty |
| South American Indians | 32.5 /100 | #189 | Fair 5.3% |
| Ugandans | 31.6 /100 | #190 | Fair 5.3% |
| Immigrants | Cabo Verde | 30.9 /100 | #191 | Fair 5.3% |
| Cape Verdeans | 30.7 /100 | #192 | Fair 5.3% |
| Malaysians | 29.5 /100 | #193 | Fair 5.4% |
| Immigrants | Israel | 27.8 /100 | #194 | Fair 5.4% |
| Immigrants | Azores | 27.5 /100 | #195 | Fair 5.4% |
| Spaniards | 27.4 /100 | #196 | Fair 5.4% |
| Liberians | 26.3 /100 | #197 | Fair 5.4% |
| Immigrants | Belarus | 26.2 /100 | #198 | Fair 5.4% |
| Uruguayans | 25.0 /100 | #199 | Fair 5.4% |
| Immigrants | Morocco | 24.3 /100 | #200 | Fair 5.4% |
| Lebanese | 24.1 /100 | #201 | Fair 5.4% |
| Immigrants | Middle Africa | 23.8 /100 | #202 | Fair 5.4% |
| Immigrants | Peru | 21.8 /100 | #203 | Fair 5.4% |