Immigrants from Congo vs Immigrants from Canada Unemployment Among Women with Children Under 6 years
COMPARE
Immigrants from Congo
Immigrants from Canada
Unemployment Among Women with Children Under 6 years
Unemployment Among Women with Children Under 6 years Comparison
Immigrants from Congo
Immigrants from Canada
8.5%
UNEMPLOYMENT AMONG WOMEN WITH CHILDREN UNDER 6 YEARS
0.2/ 100
METRIC RATING
271st/ 347
METRIC RANK
7.6%
UNEMPLOYMENT AMONG WOMEN WITH CHILDREN UNDER 6 YEARS
61.6/ 100
METRIC RATING
168th/ 347
METRIC RANK
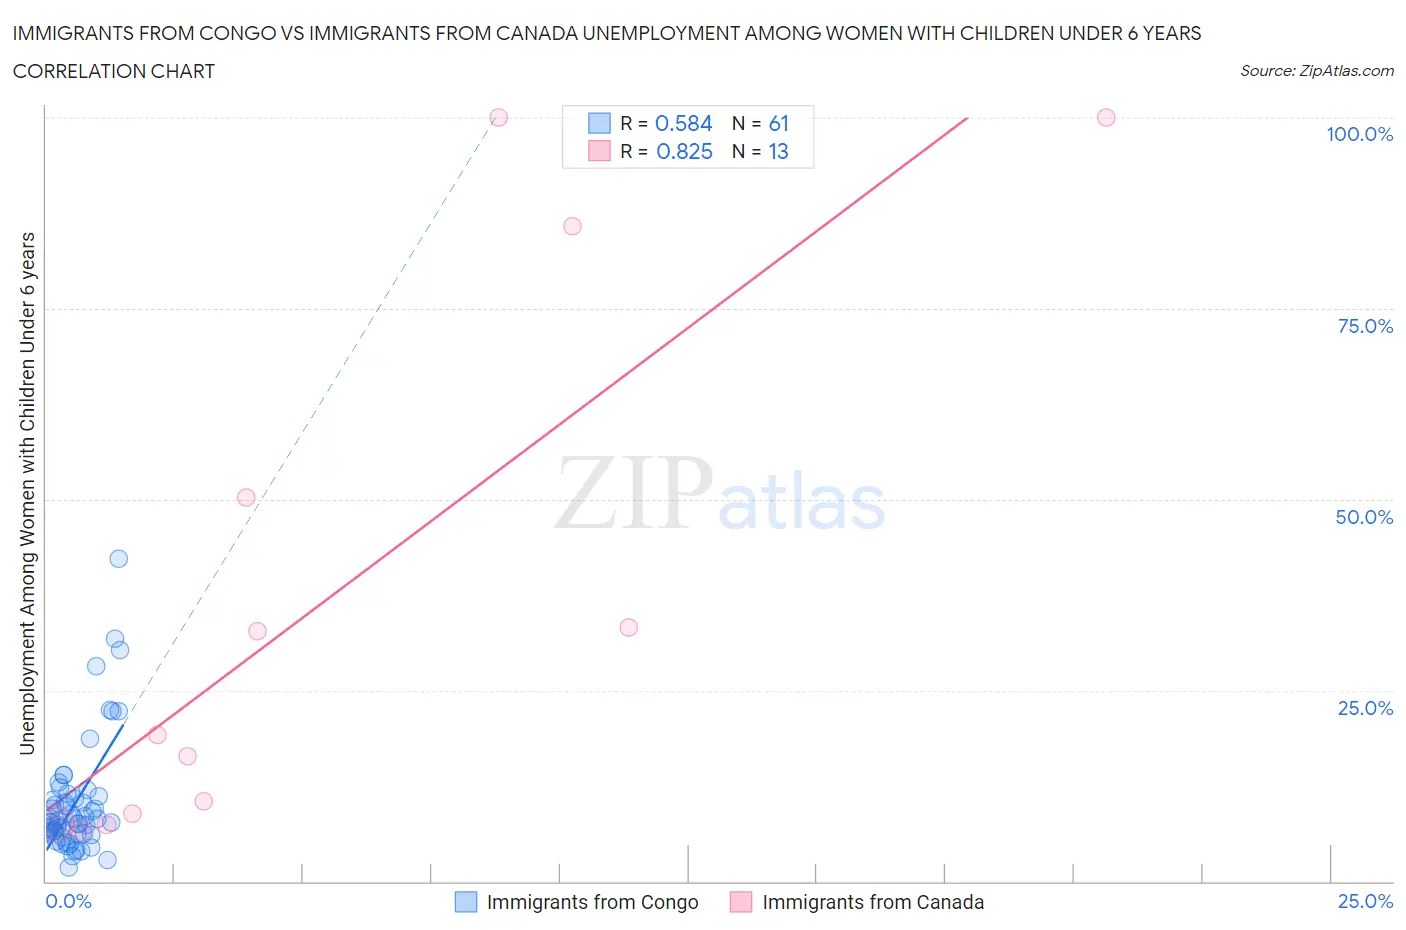
Immigrants from Congo vs Immigrants from Canada Unemployment Among Women with Children Under 6 years Correlation Chart
The statistical analysis conducted on geographies consisting of 85,861,208 people shows a substantial positive correlation between the proportion of Immigrants from Congo and unemployment rate among women with children under the age of 6 in the United States with a correlation coefficient (R) of 0.584 and weighted average of 8.5%. Similarly, the statistical analysis conducted on geographies consisting of 330,910,201 people shows a very strong positive correlation between the proportion of Immigrants from Canada and unemployment rate among women with children under the age of 6 in the United States with a correlation coefficient (R) of 0.825 and weighted average of 7.6%, a difference of 11.6%.
Unemployment Among Women with Children Under 6 years Correlation Summary
| Measurement | Immigrants from Congo | Immigrants from Canada |
| Minimum | 1.8% | 6.6% |
| Maximum | 42.3% | 100.0% |
| Range | 40.5% | 93.4% |
| Mean | 10.2% | 36.8% |
| Median | 7.8% | 19.1% |
| Interquartile 25% (IQ1) | 6.2% | 8.2% |
| Interquartile 75% (IQ3) | 11.0% | 67.9% |
| Interquartile Range (IQR) | 4.8% | 59.7% |
| Standard Deviation (Sample) | 7.6% | 35.8% |
| Standard Deviation (Population) | 7.6% | 34.4% |
Similar Demographics by Unemployment Among Women with Children Under 6 years
Demographics Similar to Immigrants from Congo by Unemployment Among Women with Children Under 6 years
In terms of unemployment among women with children under 6 years, the demographic groups most similar to Immigrants from Congo are Immigrants from Senegal (8.5%, a difference of 0.010%), Immigrants from Haiti (8.4%, a difference of 0.35%), Subsaharan African (8.4%, a difference of 0.43%), Belizean (8.4%, a difference of 0.54%), and Mexican American Indian (8.5%, a difference of 0.56%).
| Demographics | Rating | Rank | Unemployment Among Women with Children Under 6 years |
| Hondurans | 0.3 /100 | #264 | Tragic 8.4% |
| French Canadians | 0.3 /100 | #265 | Tragic 8.4% |
| Immigrants | Honduras | 0.3 /100 | #266 | Tragic 8.4% |
| Belizeans | 0.2 /100 | #267 | Tragic 8.4% |
| Sub-Saharan Africans | 0.2 /100 | #268 | Tragic 8.4% |
| Immigrants | Haiti | 0.2 /100 | #269 | Tragic 8.4% |
| Immigrants | Senegal | 0.2 /100 | #270 | Tragic 8.5% |
| Immigrants | Congo | 0.2 /100 | #271 | Tragic 8.5% |
| Mexican American Indians | 0.1 /100 | #272 | Tragic 8.5% |
| Slovaks | 0.1 /100 | #273 | Tragic 8.5% |
| Immigrants | Cameroon | 0.1 /100 | #274 | Tragic 8.6% |
| Immigrants | Latin America | 0.1 /100 | #275 | Tragic 8.6% |
| Yaqui | 0.0 /100 | #276 | Tragic 8.6% |
| Haitians | 0.0 /100 | #277 | Tragic 8.6% |
| Immigrants | Dominica | 0.0 /100 | #278 | Tragic 8.6% |
Demographics Similar to Immigrants from Canada by Unemployment Among Women with Children Under 6 years
In terms of unemployment among women with children under 6 years, the demographic groups most similar to Immigrants from Canada are Immigrants from Scotland (7.6%, a difference of 0.020%), Kenyan (7.6%, a difference of 0.070%), Czech (7.6%, a difference of 0.12%), Belgian (7.6%, a difference of 0.14%), and Immigrants from Grenada (7.6%, a difference of 0.18%).
| Demographics | Rating | Rank | Unemployment Among Women with Children Under 6 years |
| Immigrants | Western Asia | 70.2 /100 | #161 | Good 7.5% |
| Immigrants | Lithuania | 68.8 /100 | #162 | Good 7.5% |
| British | 66.3 /100 | #163 | Good 7.6% |
| Ugandans | 65.8 /100 | #164 | Good 7.6% |
| Immigrants | South America | 65.6 /100 | #165 | Good 7.6% |
| Belgians | 63.5 /100 | #166 | Good 7.6% |
| Kenyans | 62.5 /100 | #167 | Good 7.6% |
| Immigrants | Canada | 61.6 /100 | #168 | Good 7.6% |
| Immigrants | Scotland | 61.3 /100 | #169 | Good 7.6% |
| Czechs | 59.8 /100 | #170 | Average 7.6% |
| Immigrants | Grenada | 59.0 /100 | #171 | Average 7.6% |
| Immigrants | North America | 57.7 /100 | #172 | Average 7.6% |
| Cree | 51.6 /100 | #173 | Average 7.6% |
| Immigrants | Laos | 50.0 /100 | #174 | Average 7.6% |
| Panamanians | 49.6 /100 | #175 | Average 7.6% |