Immigrants from Congo vs Immigrants from Iraq Unemployment Among Women with Children Under 6 years
COMPARE
Immigrants from Congo
Immigrants from Iraq
Unemployment Among Women with Children Under 6 years
Unemployment Among Women with Children Under 6 years Comparison
Immigrants from Congo
Immigrants from Iraq
8.5%
UNEMPLOYMENT AMONG WOMEN WITH CHILDREN UNDER 6 YEARS
0.2/ 100
METRIC RATING
271st/ 347
METRIC RANK
7.0%
UNEMPLOYMENT AMONG WOMEN WITH CHILDREN UNDER 6 YEARS
99.4/ 100
METRIC RATING
70th/ 347
METRIC RANK
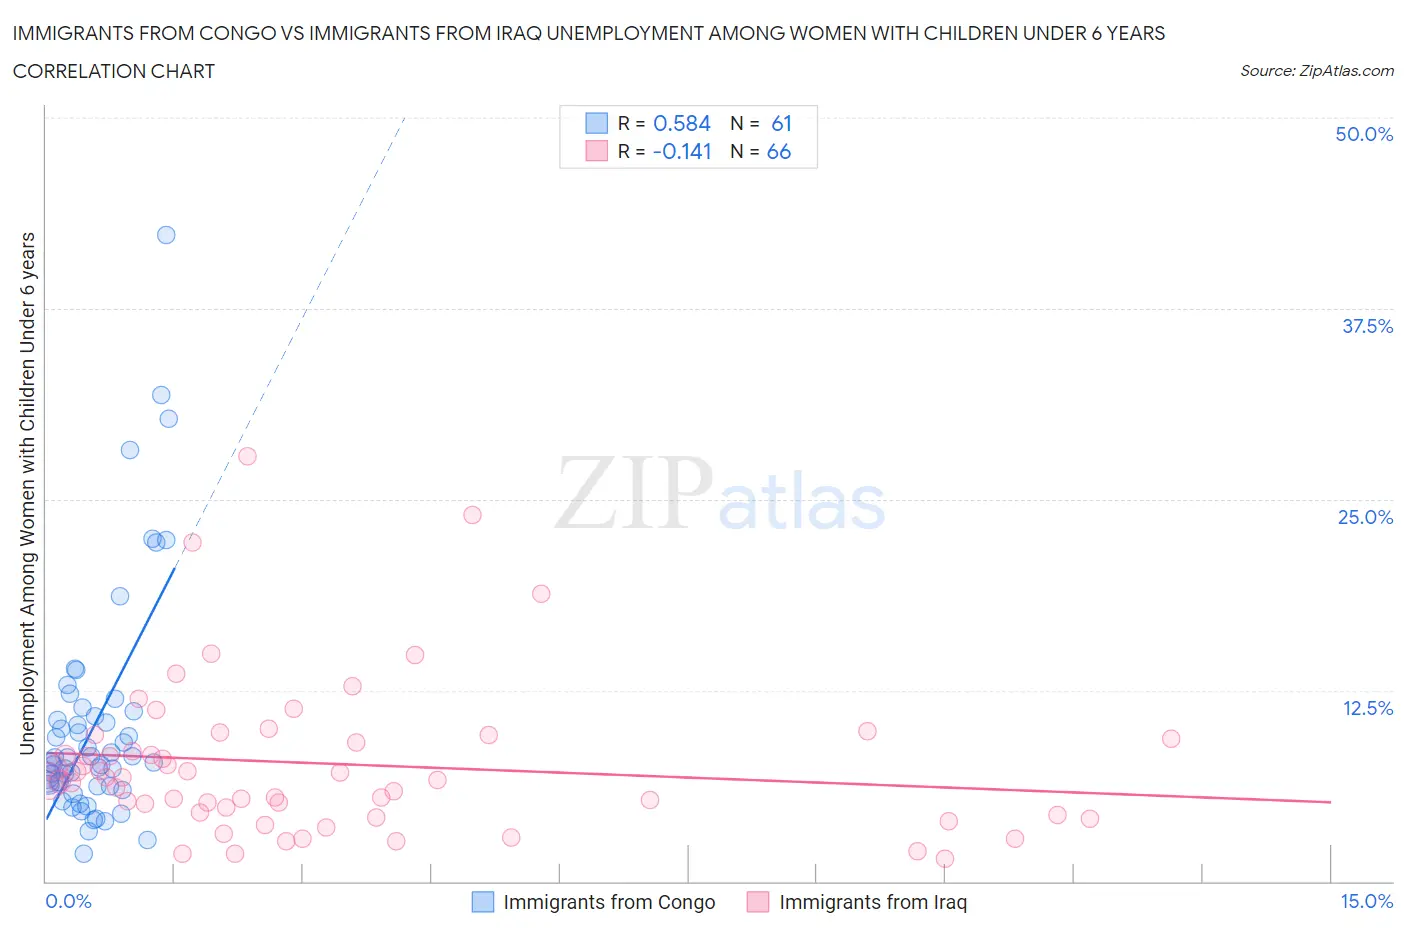
Immigrants from Congo vs Immigrants from Iraq Unemployment Among Women with Children Under 6 years Correlation Chart
The statistical analysis conducted on geographies consisting of 85,861,208 people shows a substantial positive correlation between the proportion of Immigrants from Congo and unemployment rate among women with children under the age of 6 in the United States with a correlation coefficient (R) of 0.584 and weighted average of 8.5%. Similarly, the statistical analysis conducted on geographies consisting of 165,987,654 people shows a poor negative correlation between the proportion of Immigrants from Iraq and unemployment rate among women with children under the age of 6 in the United States with a correlation coefficient (R) of -0.141 and weighted average of 7.0%, a difference of 21.1%.
Unemployment Among Women with Children Under 6 years Correlation Summary
| Measurement | Immigrants from Congo | Immigrants from Iraq |
| Minimum | 1.8% | 1.5% |
| Maximum | 42.3% | 27.8% |
| Range | 40.5% | 26.3% |
| Mean | 10.2% | 7.7% |
| Median | 7.8% | 6.7% |
| Interquartile 25% (IQ1) | 6.2% | 4.5% |
| Interquartile 75% (IQ3) | 11.0% | 9.3% |
| Interquartile Range (IQR) | 4.8% | 4.8% |
| Standard Deviation (Sample) | 7.6% | 5.1% |
| Standard Deviation (Population) | 7.6% | 5.1% |
Similar Demographics by Unemployment Among Women with Children Under 6 years
Demographics Similar to Immigrants from Congo by Unemployment Among Women with Children Under 6 years
In terms of unemployment among women with children under 6 years, the demographic groups most similar to Immigrants from Congo are Immigrants from Senegal (8.5%, a difference of 0.010%), Immigrants from Haiti (8.4%, a difference of 0.35%), Subsaharan African (8.4%, a difference of 0.43%), Belizean (8.4%, a difference of 0.54%), and Mexican American Indian (8.5%, a difference of 0.56%).
| Demographics | Rating | Rank | Unemployment Among Women with Children Under 6 years |
| Hondurans | 0.3 /100 | #264 | Tragic 8.4% |
| French Canadians | 0.3 /100 | #265 | Tragic 8.4% |
| Immigrants | Honduras | 0.3 /100 | #266 | Tragic 8.4% |
| Belizeans | 0.2 /100 | #267 | Tragic 8.4% |
| Sub-Saharan Africans | 0.2 /100 | #268 | Tragic 8.4% |
| Immigrants | Haiti | 0.2 /100 | #269 | Tragic 8.4% |
| Immigrants | Senegal | 0.2 /100 | #270 | Tragic 8.5% |
| Immigrants | Congo | 0.2 /100 | #271 | Tragic 8.5% |
| Mexican American Indians | 0.1 /100 | #272 | Tragic 8.5% |
| Slovaks | 0.1 /100 | #273 | Tragic 8.5% |
| Immigrants | Cameroon | 0.1 /100 | #274 | Tragic 8.6% |
| Immigrants | Latin America | 0.1 /100 | #275 | Tragic 8.6% |
| Yaqui | 0.0 /100 | #276 | Tragic 8.6% |
| Haitians | 0.0 /100 | #277 | Tragic 8.6% |
| Immigrants | Dominica | 0.0 /100 | #278 | Tragic 8.6% |
Demographics Similar to Immigrants from Iraq by Unemployment Among Women with Children Under 6 years
In terms of unemployment among women with children under 6 years, the demographic groups most similar to Immigrants from Iraq are Immigrants from Eritrea (7.0%, a difference of 0.010%), Afghan (7.0%, a difference of 0.020%), Paraguayan (7.0%, a difference of 0.050%), Cuban (7.0%, a difference of 0.13%), and Immigrants from Netherlands (7.0%, a difference of 0.27%).
| Demographics | Rating | Rank | Unemployment Among Women with Children Under 6 years |
| Maltese | 99.7 /100 | #63 | Exceptional 6.9% |
| Tongans | 99.7 /100 | #64 | Exceptional 6.9% |
| Immigrants | Kuwait | 99.7 /100 | #65 | Exceptional 6.9% |
| Immigrants | Belgium | 99.6 /100 | #66 | Exceptional 6.9% |
| Immigrants | Netherlands | 99.5 /100 | #67 | Exceptional 7.0% |
| Paraguayans | 99.4 /100 | #68 | Exceptional 7.0% |
| Immigrants | Eritrea | 99.4 /100 | #69 | Exceptional 7.0% |
| Immigrants | Iraq | 99.4 /100 | #70 | Exceptional 7.0% |
| Afghans | 99.4 /100 | #71 | Exceptional 7.0% |
| Cubans | 99.4 /100 | #72 | Exceptional 7.0% |
| Immigrants | Czechoslovakia | 99.2 /100 | #73 | Exceptional 7.0% |
| Turks | 99.2 /100 | #74 | Exceptional 7.0% |
| Immigrants | Eastern Europe | 99.0 /100 | #75 | Exceptional 7.1% |
| Estonians | 99.0 /100 | #76 | Exceptional 7.1% |
| Immigrants | Croatia | 98.9 /100 | #77 | Exceptional 7.1% |