Kiowa vs Puerto Rican Unemployment Among Youth under 25 years
COMPARE
Kiowa
Puerto Rican
Unemployment Among Youth under 25 years
Unemployment Among Youth under 25 years Comparison
Kiowa
Puerto Ricans
12.7%
UNEMPLOYMENT AMONG YOUTH UNDER 25 YEARS
0.0/ 100
METRIC RATING
269th/ 347
METRIC RANK
18.4%
UNEMPLOYMENT AMONG YOUTH UNDER 25 YEARS
0.0/ 100
METRIC RATING
342nd/ 347
METRIC RANK
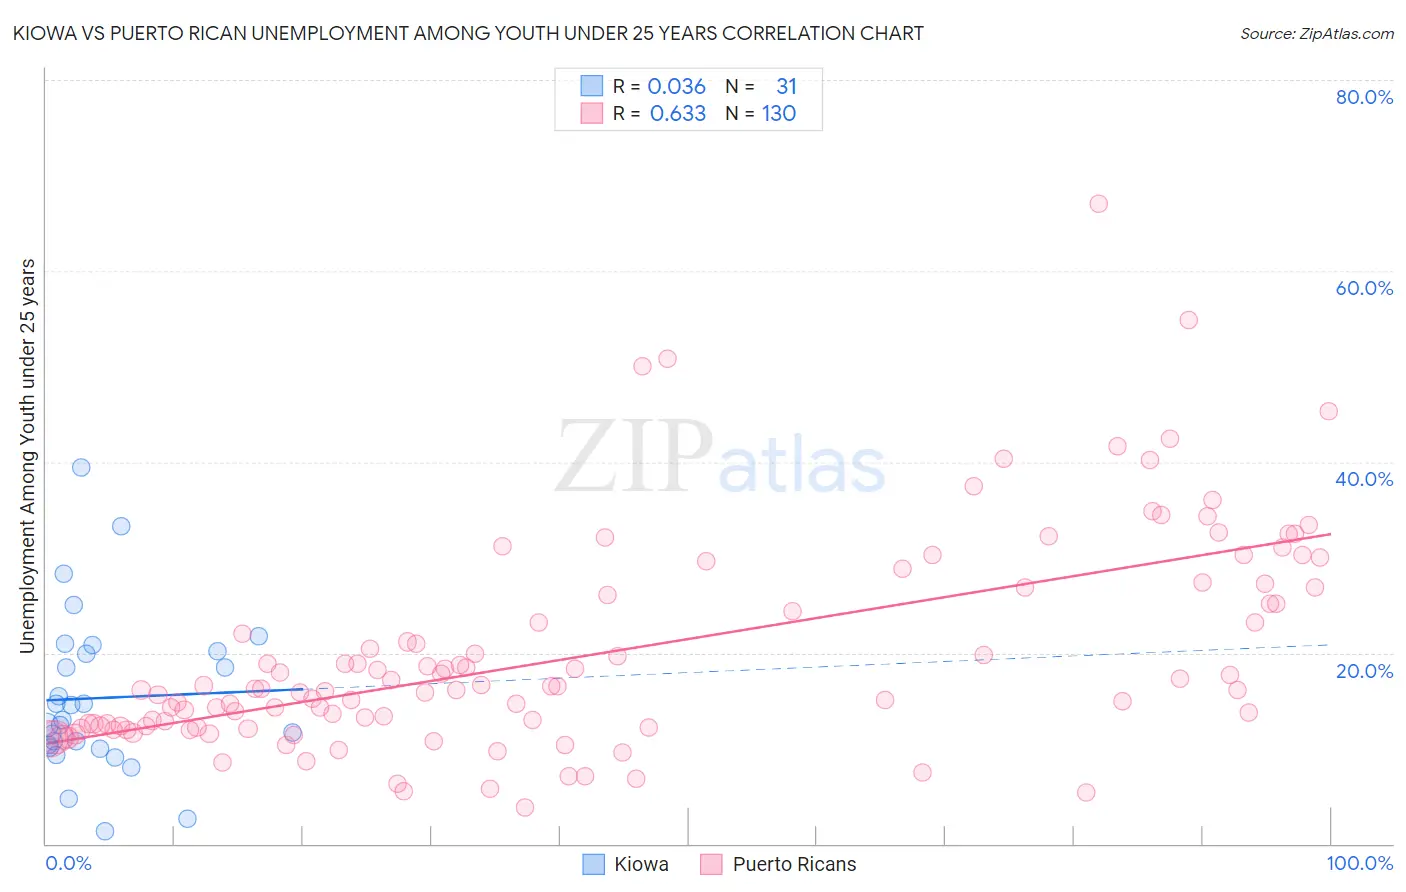
Kiowa vs Puerto Rican Unemployment Among Youth under 25 years Correlation Chart
The statistical analysis conducted on geographies consisting of 55,922,493 people shows no correlation between the proportion of Kiowa and unemployment rate among youth under the age of 25 in the United States with a correlation coefficient (R) of 0.036 and weighted average of 12.7%. Similarly, the statistical analysis conducted on geographies consisting of 515,241,059 people shows a significant positive correlation between the proportion of Puerto Ricans and unemployment rate among youth under the age of 25 in the United States with a correlation coefficient (R) of 0.633 and weighted average of 18.4%, a difference of 45.3%.
Unemployment Among Youth under 25 years Correlation Summary
| Measurement | Kiowa | Puerto Rican |
| Minimum | 1.3% | 3.8% |
| Maximum | 39.4% | 67.0% |
| Range | 38.1% | 63.2% |
| Mean | 15.3% | 19.8% |
| Median | 12.9% | 16.2% |
| Interquartile 25% (IQ1) | 10.1% | 12.3% |
| Interquartile 75% (IQ3) | 20.1% | 26.0% |
| Interquartile Range (IQR) | 10.0% | 13.7% |
| Standard Deviation (Sample) | 8.4% | 11.1% |
| Standard Deviation (Population) | 8.2% | 11.1% |
Similar Demographics by Unemployment Among Youth under 25 years
Demographics Similar to Kiowa by Unemployment Among Youth under 25 years
In terms of unemployment among youth under 25 years, the demographic groups most similar to Kiowa are Tlingit-Haida (12.7%, a difference of 0.12%), Subsaharan African (12.6%, a difference of 0.20%), Immigrants from Latin America (12.6%, a difference of 0.34%), Immigrants from Liberia (12.8%, a difference of 1.1%), and Nepalese (12.5%, a difference of 1.2%).
| Demographics | Rating | Rank | Unemployment Among Youth under 25 years |
| Immigrants | Mexico | 0.1 /100 | #262 | Tragic 12.4% |
| Cree | 0.1 /100 | #263 | Tragic 12.4% |
| Puget Sound Salish | 0.1 /100 | #264 | Tragic 12.5% |
| Nepalese | 0.0 /100 | #265 | Tragic 12.5% |
| Immigrants | Latin America | 0.0 /100 | #266 | Tragic 12.6% |
| Sub-Saharan Africans | 0.0 /100 | #267 | Tragic 12.6% |
| Tlingit-Haida | 0.0 /100 | #268 | Tragic 12.7% |
| Kiowa | 0.0 /100 | #269 | Tragic 12.7% |
| Immigrants | Liberia | 0.0 /100 | #270 | Tragic 12.8% |
| Immigrants | Bahamas | 0.0 /100 | #271 | Tragic 12.9% |
| Cape Verdeans | 0.0 /100 | #272 | Tragic 12.9% |
| Nigerians | 0.0 /100 | #273 | Tragic 13.0% |
| Immigrants | Nigeria | 0.0 /100 | #274 | Tragic 13.0% |
| Bermudans | 0.0 /100 | #275 | Tragic 13.0% |
| Immigrants | Uzbekistan | 0.0 /100 | #276 | Tragic 13.1% |
Demographics Similar to Puerto Ricans by Unemployment Among Youth under 25 years
In terms of unemployment among youth under 25 years, the demographic groups most similar to Puerto Ricans are Navajo (18.6%, a difference of 1.2%), Paiute (17.6%, a difference of 4.8%), Crow (20.1%, a difference of 9.0%), Colville (16.8%, a difference of 9.8%), and Tsimshian (16.5%, a difference of 11.7%).
| Demographics | Rating | Rank | Unemployment Among Youth under 25 years |
| Guyanese | 0.0 /100 | #333 | Tragic 15.9% |
| Immigrants | Guyana | 0.0 /100 | #334 | Tragic 15.9% |
| Immigrants | St. Vincent and the Grenadines | 0.0 /100 | #335 | Tragic 16.1% |
| Pima | 0.0 /100 | #336 | Tragic 16.2% |
| Arapaho | 0.0 /100 | #337 | Tragic 16.3% |
| Yuman | 0.0 /100 | #338 | Tragic 16.3% |
| Tsimshian | 0.0 /100 | #339 | Tragic 16.5% |
| Colville | 0.0 /100 | #340 | Tragic 16.8% |
| Paiute | 0.0 /100 | #341 | Tragic 17.6% |
| Puerto Ricans | 0.0 /100 | #342 | Tragic 18.4% |
| Navajo | 0.0 /100 | #343 | Tragic 18.6% |
| Crow | 0.0 /100 | #344 | Tragic 20.1% |
| Hopi | 0.0 /100 | #345 | Tragic 21.5% |
| Inupiat | 0.0 /100 | #346 | Tragic 22.0% |
| Yup'ik | 0.0 /100 | #347 | Tragic 23.7% |