Trinidadian and Tobagonian vs Puerto Rican Unemployment Among Youth under 25 years
COMPARE
Trinidadian and Tobagonian
Puerto Rican
Unemployment Among Youth under 25 years
Unemployment Among Youth under 25 years Comparison
Trinidadians and Tobagonians
Puerto Ricans
14.6%
UNEMPLOYMENT AMONG YOUTH UNDER 25 YEARS
0.0/ 100
METRIC RATING
322nd/ 347
METRIC RANK
18.4%
UNEMPLOYMENT AMONG YOUTH UNDER 25 YEARS
0.0/ 100
METRIC RATING
342nd/ 347
METRIC RANK
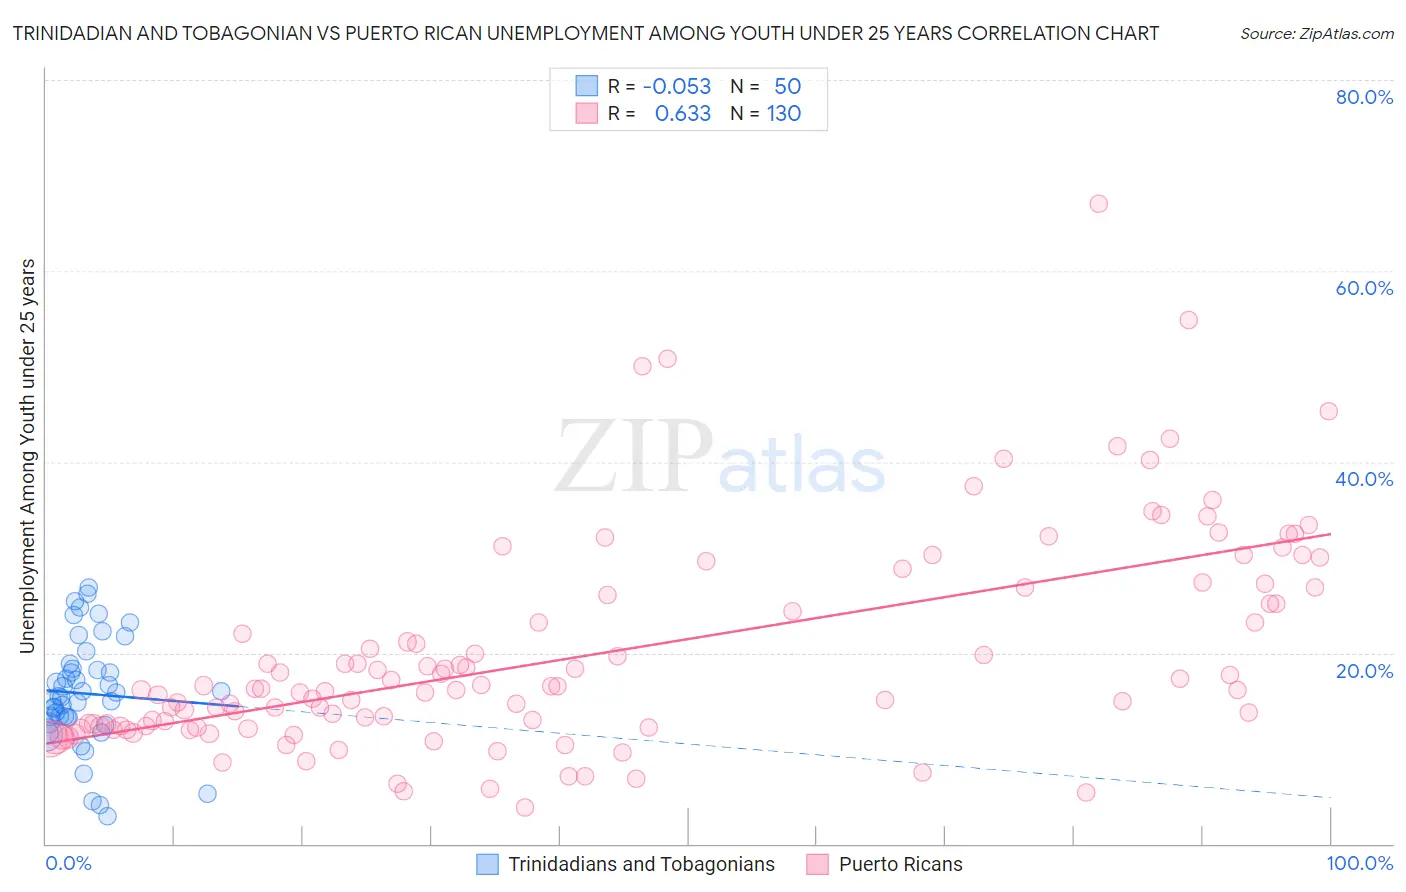
Trinidadian and Tobagonian vs Puerto Rican Unemployment Among Youth under 25 years Correlation Chart
The statistical analysis conducted on geographies consisting of 218,912,692 people shows a slight negative correlation between the proportion of Trinidadians and Tobagonians and unemployment rate among youth under the age of 25 in the United States with a correlation coefficient (R) of -0.053 and weighted average of 14.6%. Similarly, the statistical analysis conducted on geographies consisting of 515,241,059 people shows a significant positive correlation between the proportion of Puerto Ricans and unemployment rate among youth under the age of 25 in the United States with a correlation coefficient (R) of 0.633 and weighted average of 18.4%, a difference of 25.9%.
Unemployment Among Youth under 25 years Correlation Summary
| Measurement | Trinidadian and Tobagonian | Puerto Rican |
| Minimum | 2.9% | 3.8% |
| Maximum | 26.9% | 67.0% |
| Range | 24.0% | 63.2% |
| Mean | 15.7% | 19.8% |
| Median | 15.4% | 16.2% |
| Interquartile 25% (IQ1) | 13.2% | 12.3% |
| Interquartile 75% (IQ3) | 18.3% | 26.0% |
| Interquartile Range (IQR) | 5.1% | 13.7% |
| Standard Deviation (Sample) | 5.7% | 11.1% |
| Standard Deviation (Population) | 5.6% | 11.1% |
Demographics Similar to Trinidadians and Tobagonians and Puerto Ricans by Unemployment Among Youth under 25 years
In terms of unemployment among youth under 25 years, the demographic groups most similar to Trinidadians and Tobagonians are Immigrants from Trinidad and Tobago (14.6%, a difference of 0.090%), Immigrants from Jamaica (14.8%, a difference of 1.3%), Alaska Native (14.9%, a difference of 1.9%), Immigrants from Barbados (15.2%, a difference of 4.2%), and British West Indian (15.5%, a difference of 6.3%). Similarly, the demographic groups most similar to Puerto Ricans are Paiute (17.6%, a difference of 4.8%), Colville (16.8%, a difference of 9.8%), Tsimshian (16.5%, a difference of 11.7%), Yuman (16.3%, a difference of 12.8%), and Arapaho (16.3%, a difference of 13.1%).
| Demographics | Rating | Rank | Unemployment Among Youth under 25 years |
| Trinidadians and Tobagonians | 0.0 /100 | #322 | Tragic 14.6% |
| Immigrants | Trinidad and Tobago | 0.0 /100 | #323 | Tragic 14.6% |
| Immigrants | Jamaica | 0.0 /100 | #324 | Tragic 14.8% |
| Alaska Natives | 0.0 /100 | #325 | Tragic 14.9% |
| Immigrants | Barbados | 0.0 /100 | #326 | Tragic 15.2% |
| British West Indians | 0.0 /100 | #327 | Tragic 15.5% |
| Immigrants | Dominican Republic | 0.0 /100 | #328 | Tragic 15.6% |
| Immigrants | Yemen | 0.0 /100 | #329 | Tragic 15.6% |
| Yakama | 0.0 /100 | #330 | Tragic 15.6% |
| Dominicans | 0.0 /100 | #331 | Tragic 15.7% |
| Immigrants | Grenada | 0.0 /100 | #332 | Tragic 15.8% |
| Guyanese | 0.0 /100 | #333 | Tragic 15.9% |
| Immigrants | Guyana | 0.0 /100 | #334 | Tragic 15.9% |
| Immigrants | St. Vincent and the Grenadines | 0.0 /100 | #335 | Tragic 16.1% |
| Pima | 0.0 /100 | #336 | Tragic 16.2% |
| Arapaho | 0.0 /100 | #337 | Tragic 16.3% |
| Yuman | 0.0 /100 | #338 | Tragic 16.3% |
| Tsimshian | 0.0 /100 | #339 | Tragic 16.5% |
| Colville | 0.0 /100 | #340 | Tragic 16.8% |
| Paiute | 0.0 /100 | #341 | Tragic 17.6% |
| Puerto Ricans | 0.0 /100 | #342 | Tragic 18.4% |