Luxembourger vs Lumbee 2 or more Vehicles in Household
COMPARE
Luxembourger
Lumbee
2 or more Vehicles in Household
2 or more Vehicles in Household Comparison
Luxembourgers
Lumbee
59.1%
2 OR MORE VEHICLES IN HOUSEHOLD
99.9/ 100
METRIC RATING
55th/ 347
METRIC RANK
55.9%
2 OR MORE VEHICLES IN HOUSEHOLD
71.9/ 100
METRIC RATING
153rd/ 347
METRIC RANK
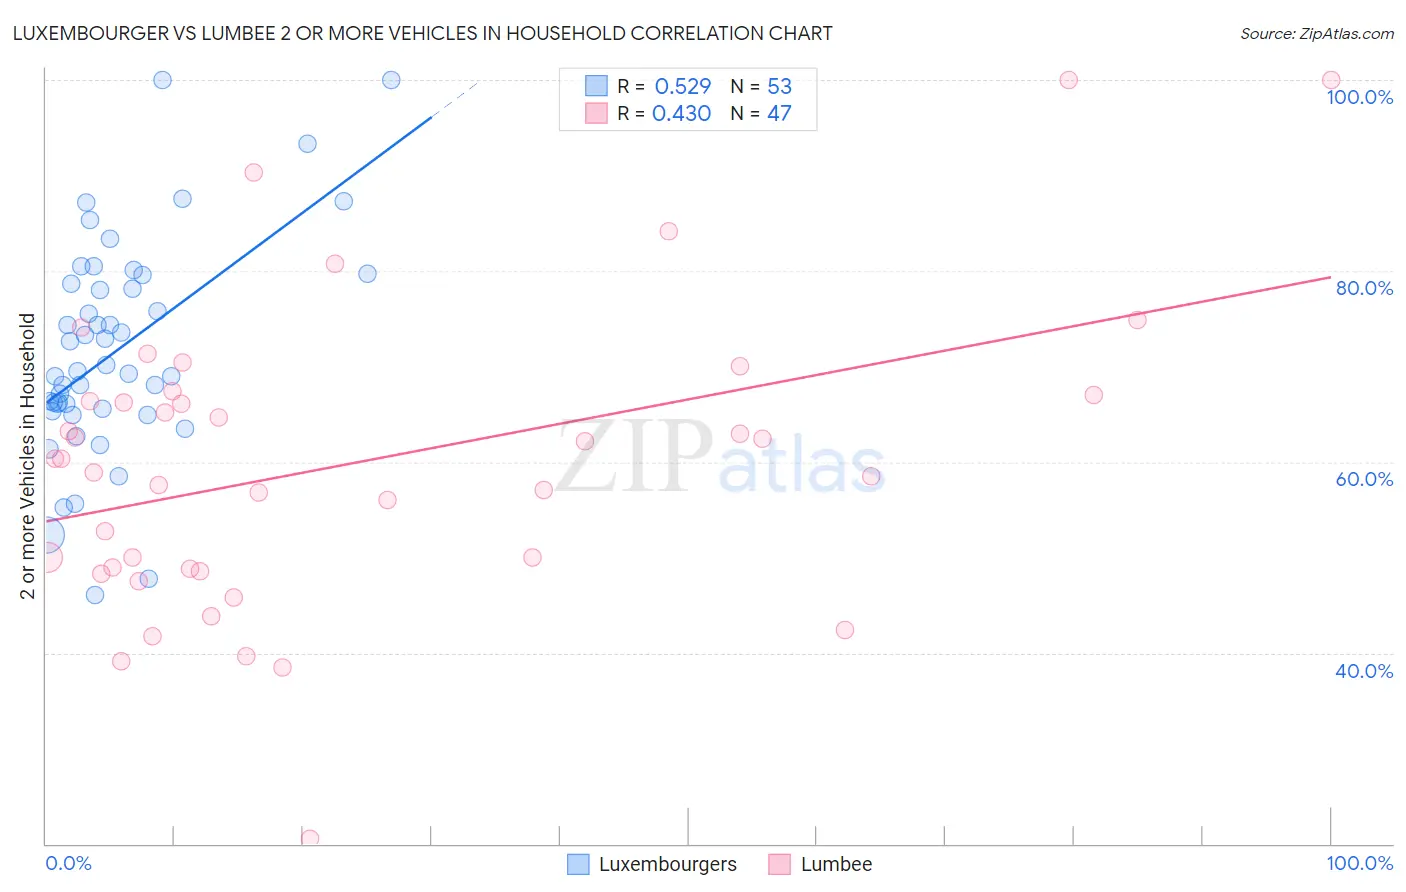
Luxembourger vs Lumbee 2 or more Vehicles in Household Correlation Chart
The statistical analysis conducted on geographies consisting of 144,657,746 people shows a substantial positive correlation between the proportion of Luxembourgers and percentage of households with 2 or more vehicles available in the United States with a correlation coefficient (R) of 0.529 and weighted average of 59.1%. Similarly, the statistical analysis conducted on geographies consisting of 92,265,071 people shows a moderate positive correlation between the proportion of Lumbee and percentage of households with 2 or more vehicles available in the United States with a correlation coefficient (R) of 0.430 and weighted average of 55.9%, a difference of 5.7%.
2 or more Vehicles in Household Correlation Summary
| Measurement | Luxembourger | Lumbee |
| Minimum | 46.0% | 20.5% |
| Maximum | 100.0% | 100.0% |
| Range | 54.0% | 79.5% |
| Mean | 71.7% | 59.9% |
| Median | 69.5% | 60.3% |
| Interquartile 25% (IQ1) | 65.4% | 48.9% |
| Interquartile 75% (IQ3) | 79.1% | 67.0% |
| Interquartile Range (IQR) | 13.7% | 18.1% |
| Standard Deviation (Sample) | 11.4% | 15.6% |
| Standard Deviation (Population) | 11.3% | 15.5% |
Similar Demographics by 2 or more Vehicles in Household
Demographics Similar to Luxembourgers by 2 or more Vehicles in Household
In terms of 2 or more vehicles in household, the demographic groups most similar to Luxembourgers are Bhutanese (59.1%, a difference of 0.030%), Chickasaw (59.0%, a difference of 0.11%), Afghan (59.0%, a difference of 0.11%), Celtic (59.2%, a difference of 0.18%), and Spaniard (59.2%, a difference of 0.19%).
| Demographics | Rating | Rank | 2 or more Vehicles in Household |
| Immigrants | India | 99.9 /100 | #48 | Exceptional 59.3% |
| Belgians | 99.9 /100 | #49 | Exceptional 59.3% |
| Choctaw | 99.9 /100 | #50 | Exceptional 59.3% |
| Spaniards | 99.9 /100 | #51 | Exceptional 59.2% |
| Immigrants | Laos | 99.9 /100 | #52 | Exceptional 59.2% |
| Celtics | 99.9 /100 | #53 | Exceptional 59.2% |
| Bhutanese | 99.9 /100 | #54 | Exceptional 59.1% |
| Luxembourgers | 99.9 /100 | #55 | Exceptional 59.1% |
| Chickasaw | 99.9 /100 | #56 | Exceptional 59.0% |
| Afghans | 99.9 /100 | #57 | Exceptional 59.0% |
| Immigrants | Scotland | 99.8 /100 | #58 | Exceptional 58.9% |
| Spanish Americans | 99.8 /100 | #59 | Exceptional 58.9% |
| French Canadians | 99.8 /100 | #60 | Exceptional 58.9% |
| Osage | 99.8 /100 | #61 | Exceptional 58.8% |
| Immigrants | Nonimmigrants | 99.8 /100 | #62 | Exceptional 58.8% |
Demographics Similar to Lumbee by 2 or more Vehicles in Household
In terms of 2 or more vehicles in household, the demographic groups most similar to Lumbee are Ukrainian (55.8%, a difference of 0.060%), Immigrants from Venezuela (55.8%, a difference of 0.060%), Immigrants from Lithuania (55.8%, a difference of 0.070%), Immigrants from Kuwait (55.8%, a difference of 0.080%), and Tlingit-Haida (55.8%, a difference of 0.16%).
| Demographics | Rating | Rank | 2 or more Vehicles in Household |
| Venezuelans | 80.7 /100 | #146 | Excellent 56.1% |
| Serbians | 80.3 /100 | #147 | Excellent 56.1% |
| Immigrants | Moldova | 80.2 /100 | #148 | Excellent 56.1% |
| Chileans | 80.2 /100 | #149 | Excellent 56.1% |
| Nicaraguans | 79.9 /100 | #150 | Good 56.1% |
| Immigrants | Northern Europe | 78.7 /100 | #151 | Good 56.1% |
| Immigrants | Pakistan | 78.1 /100 | #152 | Good 56.1% |
| Lumbee | 71.9 /100 | #153 | Good 55.9% |
| Ukrainians | 70.8 /100 | #154 | Good 55.8% |
| Immigrants | Venezuela | 70.7 /100 | #155 | Good 55.8% |
| Immigrants | Lithuania | 70.4 /100 | #156 | Good 55.8% |
| Immigrants | Kuwait | 70.2 /100 | #157 | Good 55.8% |
| Tlingit-Haida | 68.5 /100 | #158 | Good 55.8% |
| Paiute | 68.0 /100 | #159 | Good 55.8% |
| Crow | 67.0 /100 | #160 | Good 55.7% |