Volume Based Technical Analysis
Long-Term Analysis Example (Trading System)
We define a long-term trend as a broad market trend that commonly persists over several years. No matter what timeframe you trade - the short-, mid-, or the long-term - our position is that you should always know about the market's prevailing long-term direction.
The following example discusses a long-term index reversal on the S&P 500.
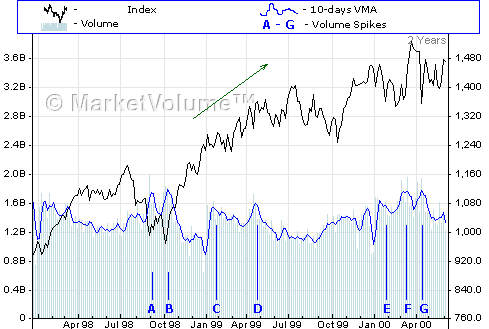
Chart #1: Example of a long-term trend reversal. 1998-2002. S&P 500 index. 5-year chart.
Chart 1 shows several key volume surges appearing on the S&P 500 index between 1998 and 2000. At points A and B, we see two long-term volume surges culminating between the end of August 1998 and the end of October 1998. During this time, a great number of (low-priced) shares were transferred from one group of investors to another, driving the market into a strongly oversold condition which ultimately prompted a brisk 2-year rally on the index.
Ideally, the smaller mid-term volume surge seen at point C should be analyzed using a chart with a lesser timeframe. However, it is clear from Chart 1 that compared to the surges at points A and B, this particular volume surge is both smaller in duration and in magnitude. We could therefore anticipate that its potential impact on the index would be comparatively lower than that resulting from surges A and B. The surge at point C lasted only a few weeks (i.e., it had a comparatively short duration) and occurred roughly in February 1999, not far along the newly established uptrend, still close to the surges seen at points A and B. Surge C impeded the progress of the uptrend only for about two months (i.e., in January and February 1999).
The mid-term surge that occurred at point D is to the up-side as well; however, it appeared further along the by now well-established uptrend and much further away from the surges seen at points A and B. Although similar in magnitude and duration to the surge at point C, surge D exerted a much more pronounced influence on the market. Not only did it halt the upward progress of the index for some 8 months (until the end of October 1999), it also brought a decline of 15%.
A look at a 5-year chart (not shown here) reveals a market that had become extremely oversold near points A and B. This oversold condition ultimately resulted in the birth of a new uptrend, which took place in the vicinity of the two large volume surges discussed earlier. Because the index's progress up to point C was relatively minor, and since this rally occurred on very low volume, the market's oversold status had not been significantly relieved by the time it reached point C. Consequently, the impact of the volume surge at point C remained comparatively limited. After point C, the index progressed further along its new uptrend, and the market was far less oversold by the time it reached point D. By this time, a great number of high-priced (in compare with A, B points) shares had already been transferred among various groups of investors (note the much higher average volume between points C and D compared to points B and C). Given these factors, it is reasonable to assume that the surge at point D would likely have a far greater impact on the market than that resulting from surge C.
The long-term volume surges that appear even further along the uptrend - at points E, F, and G - also mark areas where a significant number of high-priced shares were exchanged between groups of investors. Volume was very elevated between November 1999 and March 2000, pointing to a very significant share transfer activity. As a result, after the oversold/overbought balance was seriously hit in the G point, the market become extremely overbought for a long-term.
Summary: If they appears after a long run in one direction (i.e., a strong trend), the appearance of substantial volume surges signifies a large number of shares being transferred from one group of market participants to another. It is at such points that the market tends to become "overbought" or "oversold". By analyzing the corresponding volume surges - their magnitude (how big they are), duration (how prolonged in time they are), as well as the distance they appear from a previous key reversal point - investors can gauge when the market is likely to reverse - over the short-, mid-, or long-term. Significant volume surges that persist for more than a month have the potential to affect market trends over the long-term.
NEXT: Volume Technical Analysis Tutorial
By V. K. for MarketVolume.com
Our pages are constantly scanned. If we see that any of our content is published on other website, our first action will be to report this site to Google and Yahoo as a spam website.