Aleut vs Immigrants from Iraq Median Household Income
COMPARE
Aleut
Immigrants from Iraq
Median Household Income
Median Household Income Comparison
Aleuts
Immigrants from Iraq
$83,446
MEDIAN HOUSEHOLD INCOME
25.7/ 100
METRIC RATING
197th/ 347
METRIC RANK
$82,594
MEDIAN HOUSEHOLD INCOME
16.7/ 100
METRIC RATING
209th/ 347
METRIC RANK
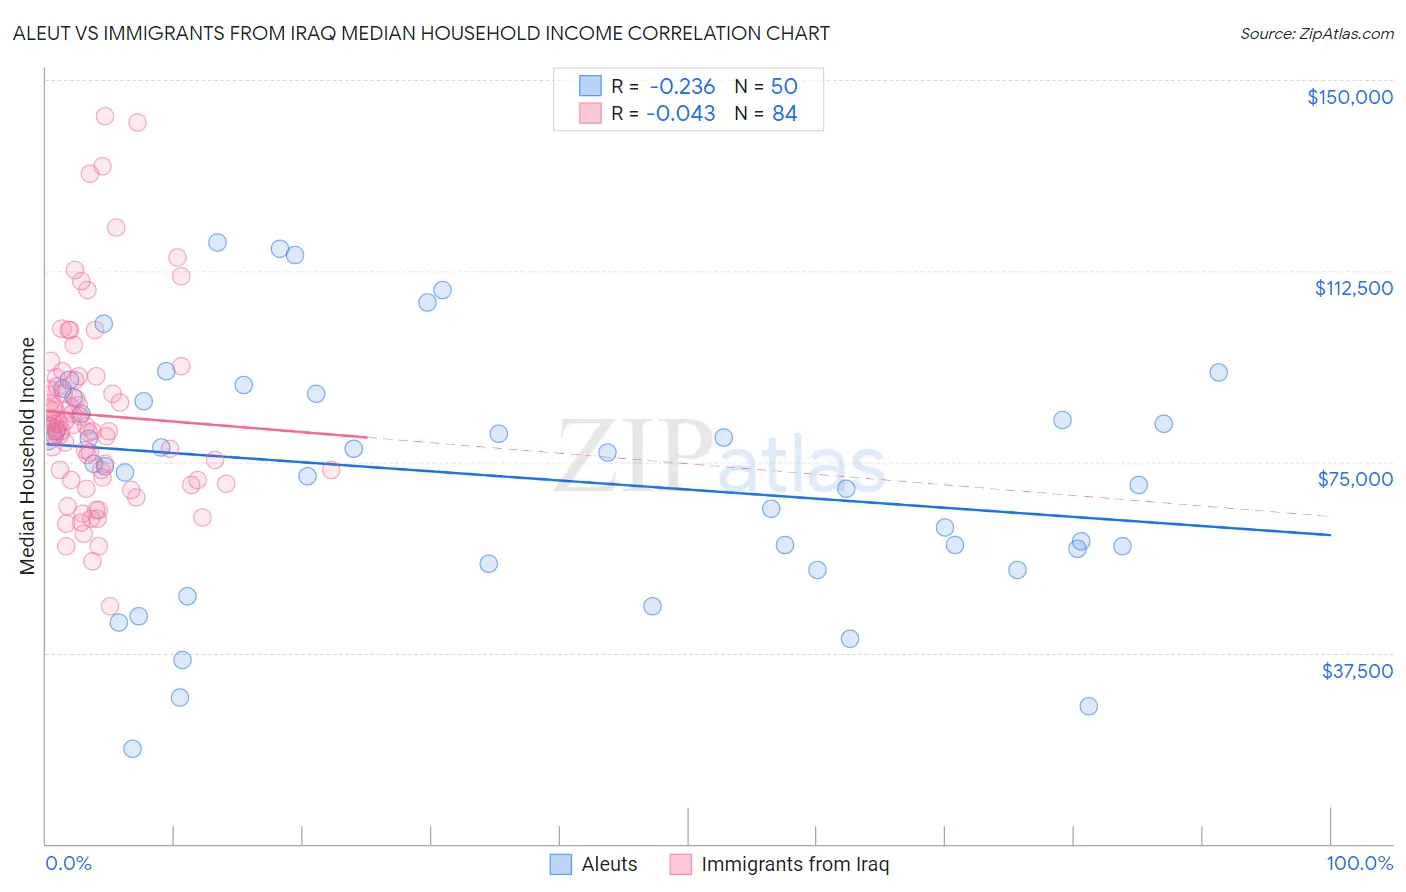
Aleut vs Immigrants from Iraq Median Household Income Correlation Chart
The statistical analysis conducted on geographies consisting of 61,772,916 people shows a weak negative correlation between the proportion of Aleuts and median household income in the United States with a correlation coefficient (R) of -0.236 and weighted average of $83,446. Similarly, the statistical analysis conducted on geographies consisting of 194,736,423 people shows no correlation between the proportion of Immigrants from Iraq and median household income in the United States with a correlation coefficient (R) of -0.043 and weighted average of $82,594, a difference of 1.0%.
Median Household Income Correlation Summary
| Measurement | Aleut | Immigrants from Iraq |
| Minimum | $18,750 | $46,565 |
| Maximum | $117,969 | $142,768 |
| Range | $99,219 | $96,203 |
| Mean | $72,433 | $84,180 |
| Median | $75,755 | $81,932 |
| Interquartile 25% (IQ1) | $58,000 | $71,691 |
| Interquartile 75% (IQ3) | $87,683 | $91,376 |
| Interquartile Range (IQR) | $29,683 | $19,685 |
| Standard Deviation (Sample) | $23,307 | $18,542 |
| Standard Deviation (Population) | $23,073 | $18,431 |
Demographics Similar to Aleuts and Immigrants from Iraq by Median Household Income
In terms of median household income, the demographic groups most similar to Aleuts are French ($83,468, a difference of 0.030%), Japanese ($83,395, a difference of 0.060%), German ($83,358, a difference of 0.11%), Tsimshian ($83,346, a difference of 0.12%), and Spanish ($83,343, a difference of 0.12%). Similarly, the demographic groups most similar to Immigrants from Iraq are Immigrants from Uruguay ($82,560, a difference of 0.040%), Salvadoran ($82,449, a difference of 0.18%), Venezuelan ($82,432, a difference of 0.20%), Nepalese ($82,410, a difference of 0.22%), and French Canadian ($82,810, a difference of 0.26%).
| Demographics | Rating | Rank | Median Household Income |
| Finns | 27.7 /100 | #193 | Fair $83,607 |
| Ghanaians | 27.4 /100 | #194 | Fair $83,582 |
| Immigrants | Armenia | 27.0 /100 | #195 | Fair $83,555 |
| French | 26.0 /100 | #196 | Fair $83,468 |
| Aleuts | 25.7 /100 | #197 | Fair $83,446 |
| Japanese | 25.1 /100 | #198 | Fair $83,395 |
| Germans | 24.6 /100 | #199 | Fair $83,358 |
| Tsimshian | 24.5 /100 | #200 | Fair $83,346 |
| Spanish | 24.4 /100 | #201 | Fair $83,343 |
| Immigrants | Thailand | 24.3 /100 | #202 | Fair $83,327 |
| Immigrants | Cambodia | 24.0 /100 | #203 | Fair $83,304 |
| Immigrants | Africa | 23.8 /100 | #204 | Fair $83,289 |
| Celtics | 22.7 /100 | #205 | Fair $83,193 |
| Immigrants | Kenya | 21.3 /100 | #206 | Fair $83,068 |
| Dutch | 20.3 /100 | #207 | Fair $82,971 |
| French Canadians | 18.7 /100 | #208 | Poor $82,810 |
| Immigrants | Iraq | 16.7 /100 | #209 | Poor $82,594 |
| Immigrants | Uruguay | 16.4 /100 | #210 | Poor $82,560 |
| Salvadorans | 15.4 /100 | #211 | Poor $82,449 |
| Venezuelans | 15.3 /100 | #212 | Poor $82,432 |
| Nepalese | 15.1 /100 | #213 | Poor $82,410 |