Iroquois vs Immigrants from Iraq Median Household Income
COMPARE
Iroquois
Immigrants from Iraq
Median Household Income
Median Household Income Comparison
Iroquois
Immigrants from Iraq
$74,279
MEDIAN HOUSEHOLD INCOME
0.1/ 100
METRIC RATING
287th/ 347
METRIC RANK
$82,594
MEDIAN HOUSEHOLD INCOME
16.7/ 100
METRIC RATING
209th/ 347
METRIC RANK
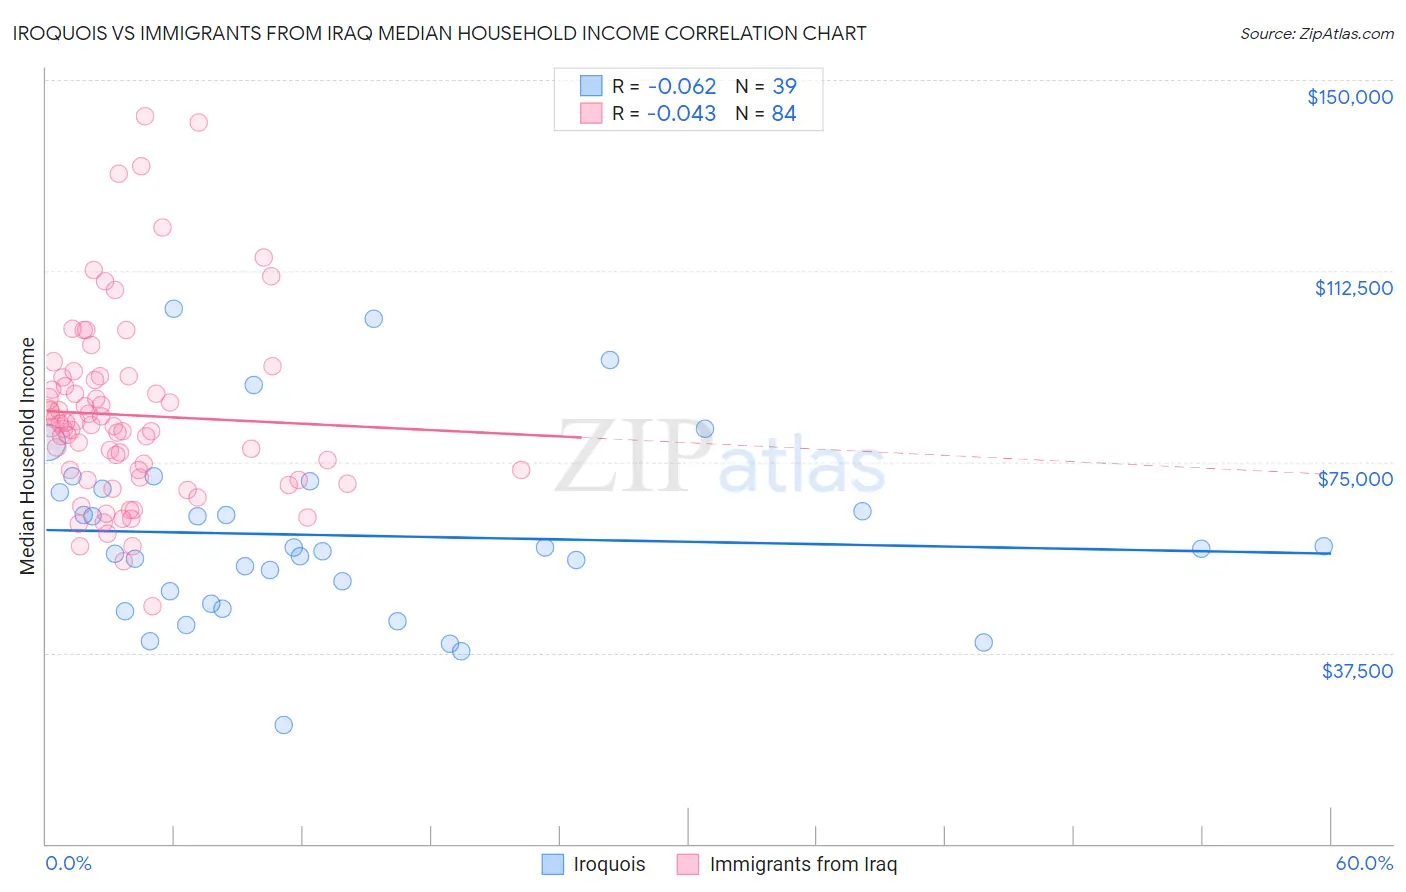
Iroquois vs Immigrants from Iraq Median Household Income Correlation Chart
The statistical analysis conducted on geographies consisting of 207,210,720 people shows a slight negative correlation between the proportion of Iroquois and median household income in the United States with a correlation coefficient (R) of -0.062 and weighted average of $74,279. Similarly, the statistical analysis conducted on geographies consisting of 194,736,423 people shows no correlation between the proportion of Immigrants from Iraq and median household income in the United States with a correlation coefficient (R) of -0.043 and weighted average of $82,594, a difference of 11.2%.
Median Household Income Correlation Summary
| Measurement | Iroquois | Immigrants from Iraq |
| Minimum | $23,438 | $46,565 |
| Maximum | $105,077 | $142,768 |
| Range | $81,639 | $96,203 |
| Mean | $60,531 | $84,180 |
| Median | $57,969 | $81,932 |
| Interquartile 25% (IQ1) | $47,045 | $71,691 |
| Interquartile 75% (IQ3) | $69,753 | $91,376 |
| Interquartile Range (IQR) | $22,708 | $19,685 |
| Standard Deviation (Sample) | $17,808 | $18,542 |
| Standard Deviation (Population) | $17,578 | $18,431 |
Similar Demographics by Median Household Income
Demographics Similar to Iroquois by Median Household Income
In terms of median household income, the demographic groups most similar to Iroquois are Immigrants from Somalia ($74,300, a difference of 0.030%), Immigrants from Central America ($74,217, a difference of 0.080%), Fijian ($74,205, a difference of 0.10%), Mexican ($74,399, a difference of 0.16%), and Bangladeshi ($74,112, a difference of 0.23%).
| Demographics | Rating | Rank | Median Household Income |
| Senegalese | 0.2 /100 | #280 | Tragic $74,999 |
| Immigrants | Liberia | 0.1 /100 | #281 | Tragic $74,896 |
| Central American Indians | 0.1 /100 | #282 | Tragic $74,847 |
| Cree | 0.1 /100 | #283 | Tragic $74,685 |
| Yaqui | 0.1 /100 | #284 | Tragic $74,596 |
| Mexicans | 0.1 /100 | #285 | Tragic $74,399 |
| Immigrants | Somalia | 0.1 /100 | #286 | Tragic $74,300 |
| Iroquois | 0.1 /100 | #287 | Tragic $74,279 |
| Immigrants | Central America | 0.1 /100 | #288 | Tragic $74,217 |
| Fijians | 0.1 /100 | #289 | Tragic $74,205 |
| Bangladeshis | 0.1 /100 | #290 | Tragic $74,112 |
| Hispanics or Latinos | 0.1 /100 | #291 | Tragic $73,823 |
| Comanche | 0.1 /100 | #292 | Tragic $73,747 |
| Immigrants | Cabo Verde | 0.1 /100 | #293 | Tragic $73,515 |
| Blackfeet | 0.1 /100 | #294 | Tragic $73,509 |
Demographics Similar to Immigrants from Iraq by Median Household Income
In terms of median household income, the demographic groups most similar to Immigrants from Iraq are Immigrants from Uruguay ($82,560, a difference of 0.040%), Salvadoran ($82,449, a difference of 0.18%), Venezuelan ($82,432, a difference of 0.20%), Nepalese ($82,410, a difference of 0.22%), and French Canadian ($82,810, a difference of 0.26%).
| Demographics | Rating | Rank | Median Household Income |
| Immigrants | Thailand | 24.3 /100 | #202 | Fair $83,327 |
| Immigrants | Cambodia | 24.0 /100 | #203 | Fair $83,304 |
| Immigrants | Africa | 23.8 /100 | #204 | Fair $83,289 |
| Celtics | 22.7 /100 | #205 | Fair $83,193 |
| Immigrants | Kenya | 21.3 /100 | #206 | Fair $83,068 |
| Dutch | 20.3 /100 | #207 | Fair $82,971 |
| French Canadians | 18.7 /100 | #208 | Poor $82,810 |
| Immigrants | Iraq | 16.7 /100 | #209 | Poor $82,594 |
| Immigrants | Uruguay | 16.4 /100 | #210 | Poor $82,560 |
| Salvadorans | 15.4 /100 | #211 | Poor $82,449 |
| Venezuelans | 15.3 /100 | #212 | Poor $82,432 |
| Nepalese | 15.1 /100 | #213 | Poor $82,410 |
| Panamanians | 14.0 /100 | #214 | Poor $82,272 |
| Vietnamese | 13.8 /100 | #215 | Poor $82,248 |
| Yugoslavians | 13.3 /100 | #216 | Poor $82,186 |