Immigrants from Bahamas vs Immigrants from Iraq Median Household Income
COMPARE
Immigrants from Bahamas
Immigrants from Iraq
Median Household Income
Median Household Income Comparison
Immigrants from Bahamas
Immigrants from Iraq
$71,349
MEDIAN HOUSEHOLD INCOME
0.0/ 100
METRIC RATING
313th/ 347
METRIC RANK
$82,594
MEDIAN HOUSEHOLD INCOME
16.7/ 100
METRIC RATING
209th/ 347
METRIC RANK
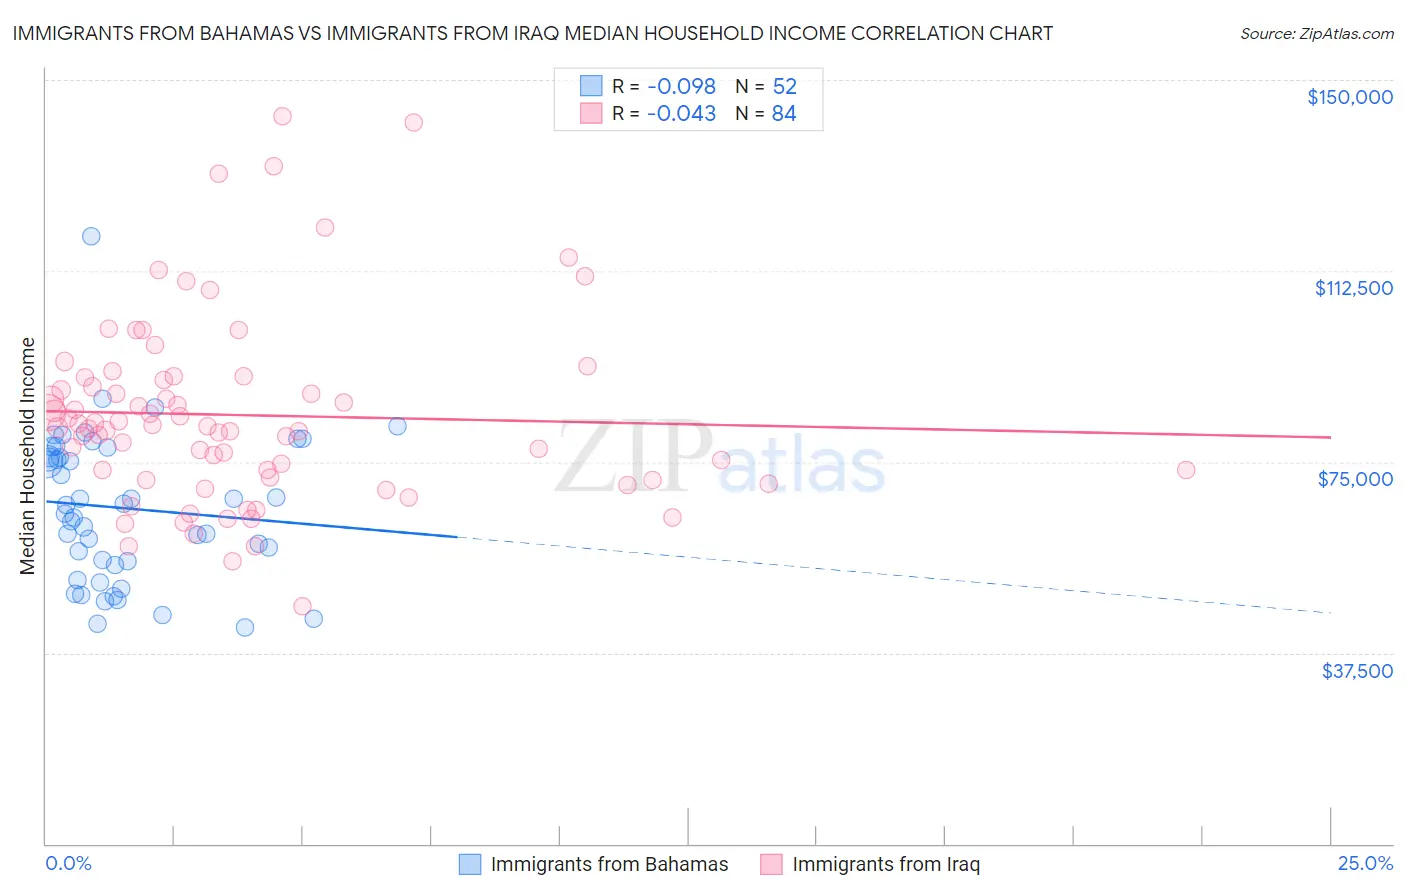
Immigrants from Bahamas vs Immigrants from Iraq Median Household Income Correlation Chart
The statistical analysis conducted on geographies consisting of 104,583,931 people shows a slight negative correlation between the proportion of Immigrants from Bahamas and median household income in the United States with a correlation coefficient (R) of -0.098 and weighted average of $71,349. Similarly, the statistical analysis conducted on geographies consisting of 194,736,423 people shows no correlation between the proportion of Immigrants from Iraq and median household income in the United States with a correlation coefficient (R) of -0.043 and weighted average of $82,594, a difference of 15.8%.
Median Household Income Correlation Summary
| Measurement | Immigrants from Bahamas | Immigrants from Iraq |
| Minimum | $42,496 | $46,565 |
| Maximum | $119,201 | $142,768 |
| Range | $76,705 | $96,203 |
| Mean | $65,863 | $84,180 |
| Median | $65,628 | $81,932 |
| Interquartile 25% (IQ1) | $55,065 | $71,691 |
| Interquartile 75% (IQ3) | $76,891 | $91,376 |
| Interquartile Range (IQR) | $21,825 | $19,685 |
| Standard Deviation (Sample) | $14,679 | $18,542 |
| Standard Deviation (Population) | $14,537 | $18,431 |
Similar Demographics by Median Household Income
Demographics Similar to Immigrants from Bahamas by Median Household Income
In terms of median household income, the demographic groups most similar to Immigrants from Bahamas are Dominican ($71,302, a difference of 0.060%), Immigrants from Honduras ($71,452, a difference of 0.15%), Ottawa ($70,984, a difference of 0.51%), Apache ($70,927, a difference of 0.59%), and Immigrants from Zaire ($71,801, a difference of 0.63%).
| Demographics | Rating | Rank | Median Household Income |
| Potawatomi | 0.0 /100 | #306 | Tragic $72,576 |
| Ute | 0.0 /100 | #307 | Tragic $72,402 |
| Yakama | 0.0 /100 | #308 | Tragic $72,225 |
| Immigrants | Caribbean | 0.0 /100 | #309 | Tragic $71,860 |
| U.S. Virgin Islanders | 0.0 /100 | #310 | Tragic $71,853 |
| Immigrants | Zaire | 0.0 /100 | #311 | Tragic $71,801 |
| Immigrants | Honduras | 0.0 /100 | #312 | Tragic $71,452 |
| Immigrants | Bahamas | 0.0 /100 | #313 | Tragic $71,349 |
| Dominicans | 0.0 /100 | #314 | Tragic $71,302 |
| Ottawa | 0.0 /100 | #315 | Tragic $70,984 |
| Apache | 0.0 /100 | #316 | Tragic $70,927 |
| Cajuns | 0.0 /100 | #317 | Tragic $70,605 |
| Chippewa | 0.0 /100 | #318 | Tragic $70,539 |
| Immigrants | Dominican Republic | 0.0 /100 | #319 | Tragic $70,208 |
| Colville | 0.0 /100 | #320 | Tragic $70,094 |
Demographics Similar to Immigrants from Iraq by Median Household Income
In terms of median household income, the demographic groups most similar to Immigrants from Iraq are Immigrants from Uruguay ($82,560, a difference of 0.040%), Salvadoran ($82,449, a difference of 0.18%), Venezuelan ($82,432, a difference of 0.20%), Nepalese ($82,410, a difference of 0.22%), and French Canadian ($82,810, a difference of 0.26%).
| Demographics | Rating | Rank | Median Household Income |
| Immigrants | Thailand | 24.3 /100 | #202 | Fair $83,327 |
| Immigrants | Cambodia | 24.0 /100 | #203 | Fair $83,304 |
| Immigrants | Africa | 23.8 /100 | #204 | Fair $83,289 |
| Celtics | 22.7 /100 | #205 | Fair $83,193 |
| Immigrants | Kenya | 21.3 /100 | #206 | Fair $83,068 |
| Dutch | 20.3 /100 | #207 | Fair $82,971 |
| French Canadians | 18.7 /100 | #208 | Poor $82,810 |
| Immigrants | Iraq | 16.7 /100 | #209 | Poor $82,594 |
| Immigrants | Uruguay | 16.4 /100 | #210 | Poor $82,560 |
| Salvadorans | 15.4 /100 | #211 | Poor $82,449 |
| Venezuelans | 15.3 /100 | #212 | Poor $82,432 |
| Nepalese | 15.1 /100 | #213 | Poor $82,410 |
| Panamanians | 14.0 /100 | #214 | Poor $82,272 |
| Vietnamese | 13.8 /100 | #215 | Poor $82,248 |
| Yugoslavians | 13.3 /100 | #216 | Poor $82,186 |