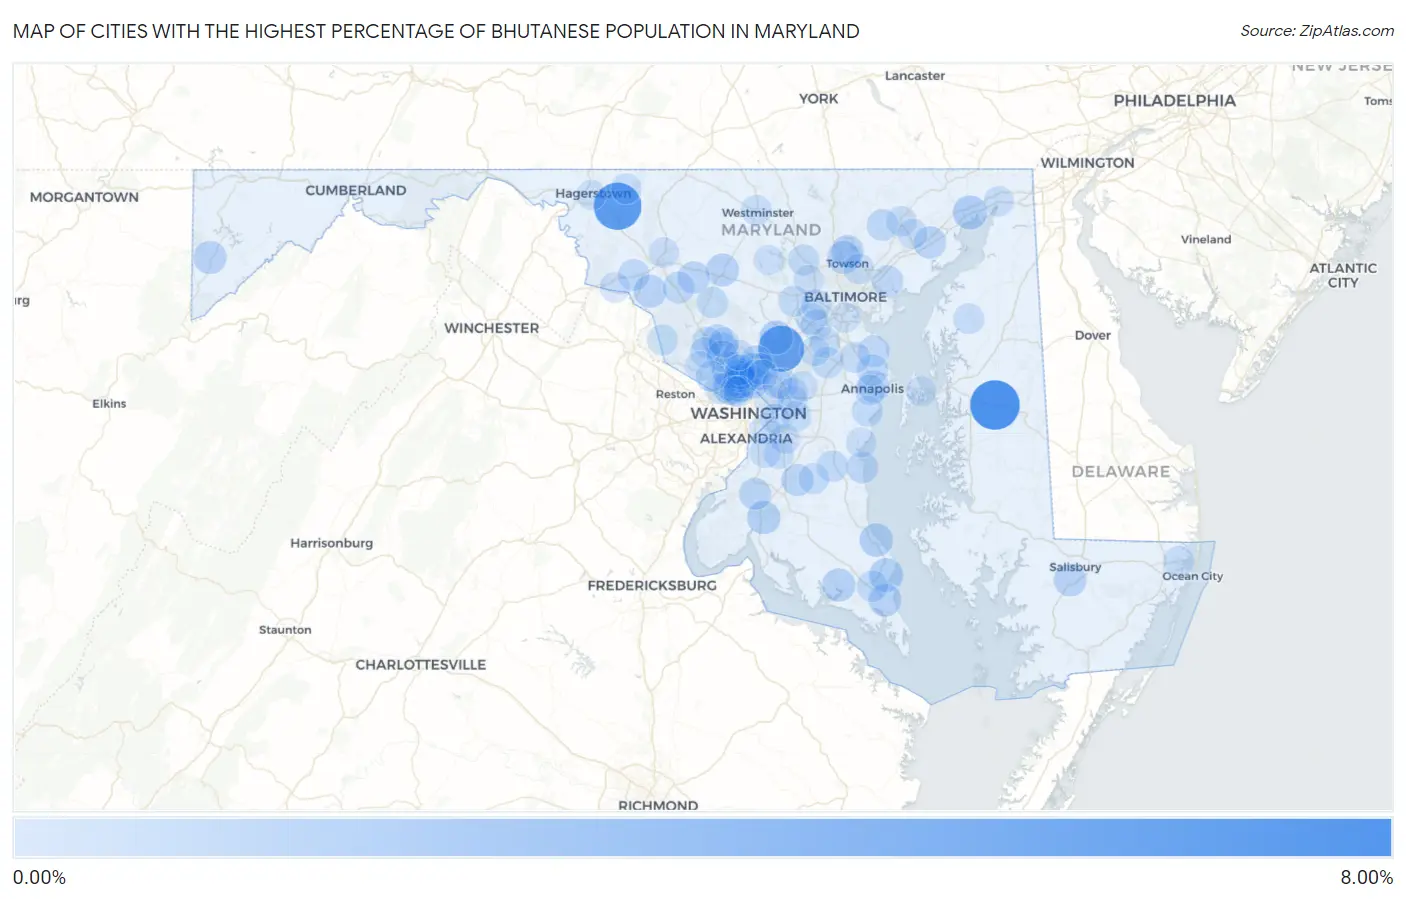
Cities with the Highest Percentage of Bhutanese Population in Maryland
RELATED REPORTS & OPTIONS
Bhutanese
Maryland
Compare Cities
Map of Cities with the Highest Percentage of Bhutanese Population in Maryland
0.00%
8.00%
Cities with the Highest Percentage of Bhutanese Population in Maryland
| City | Bhutanese | vs State | vs National | |
| 1. | Queen Anne | 6.57% | 0.32%(+6.25)#1 | 0.49%(+6.08)#214 |
| 2. | Mount Aetna | 5.86% | 0.32%(+5.54)#2 | 0.49%(+5.37)#237 |
| 3. | West Laurel | 5.36% | 0.32%(+5.04)#3 | 0.49%(+4.87)#262 |
| 4. | Chevy Chase | 2.14% | 0.32%(+1.82)#4 | 0.49%(+1.65)#713 |
| 5. | North Bethesda | 2.10% | 0.32%(+1.78)#5 | 0.49%(+1.61)#730 |
| 6. | Bethesda | 1.63% | 0.32%(+1.31)#6 | 0.49%(+1.14)#1,017 |
| 7. | North Chevy Chase | 1.62% | 0.32%(+1.30)#7 | 0.49%(+1.13)#1,028 |
| 8. | Kemp Mill | 1.57% | 0.32%(+1.26)#8 | 0.49%(+1.09)#1,063 |
| 9. | Perryville | 1.57% | 0.32%(+1.25)#9 | 0.49%(+1.08)#1,067 |
| 10. | Drum Point | 1.51% | 0.32%(+1.19)#10 | 0.49%(+1.02)#1,104 |
| 11. | Fulton | 1.45% | 0.32%(+1.14)#11 | 0.49%(+0.966)#1,160 |
| 12. | Long Beach | 1.36% | 0.32%(+1.05)#12 | 0.49%(+0.875)#1,235 |
| 13. | La Plata | 1.33% | 0.32%(+1.02)#13 | 0.49%(+0.845)#1,262 |
| 14. | Leonardtown | 1.26% | 0.32%(+0.948)#14 | 0.49%(+0.777)#1,344 |
| 15. | Oakland | 1.20% | 0.32%(+0.887)#15 | 0.49%(+0.716)#1,409 |
| 16. | Mount Airy | 1.19% | 0.32%(+0.873)#16 | 0.49%(+0.702)#1,422 |
| 17. | Lutherville | 1.18% | 0.32%(+0.866)#17 | 0.49%(+0.695)#1,430 |
| 18. | Adamstown | 1.17% | 0.32%(+0.853)#18 | 0.49%(+0.682)#1,446 |
| 19. | Lexington Park | 1.16% | 0.32%(+0.843)#19 | 0.49%(+0.672)#1,462 |
| 20. | Fruitland | 1.14% | 0.32%(+0.826)#20 | 0.49%(+0.655)#1,490 |
| 21. | Abingdon | 1.08% | 0.32%(+0.760)#21 | 0.49%(+0.589)#1,554 |
| 22. | Riverside | 1.05% | 0.32%(+0.730)#22 | 0.49%(+0.559)#1,599 |
| 23. | Derwood | 1.03% | 0.32%(+0.711)#23 | 0.49%(+0.540)#1,630 |
| 24. | Timonium | 1.02% | 0.32%(+0.703)#24 | 0.49%(+0.532)#1,649 |
| 25. | Monrovia | 0.97% | 0.32%(+0.657)#25 | 0.49%(+0.486)#1,737 |
| 26. | Cedarville | 0.97% | 0.32%(+0.651)#26 | 0.49%(+0.480)#1,747 |
| 27. | Bensville | 0.91% | 0.32%(+0.592)#27 | 0.49%(+0.421)#1,865 |
| 28. | Silver Spring | 0.90% | 0.32%(+0.587)#28 | 0.49%(+0.416)#1,881 |
| 29. | Naval Academy | 0.89% | 0.32%(+0.577)#29 | 0.49%(+0.405)#1,904 |
| 30. | Colesville | 0.86% | 0.32%(+0.545)#30 | 0.49%(+0.374)#1,987 |
| 31. | Urbana | 0.86% | 0.32%(+0.544)#31 | 0.49%(+0.372)#1,990 |
| 32. | Middle River | 0.85% | 0.32%(+0.537)#32 | 0.49%(+0.366)#2,003 |
| 33. | North Beach | 0.83% | 0.32%(+0.515)#33 | 0.49%(+0.344)#2,050 |
| 34. | Washington Grove | 0.83% | 0.32%(+0.511)#34 | 0.49%(+0.340)#2,060 |
| 35. | Lake Shore | 0.82% | 0.32%(+0.500)#35 | 0.49%(+0.329)#2,091 |
| 36. | Fallston | 0.80% | 0.32%(+0.488)#36 | 0.49%(+0.316)#2,119 |
| 37. | Jefferson | 0.80% | 0.32%(+0.486)#37 | 0.49%(+0.315)#2,125 |
| 38. | Dunkirk | 0.79% | 0.32%(+0.474)#38 | 0.49%(+0.303)#2,155 |
| 39. | Arnold | 0.76% | 0.32%(+0.445)#39 | 0.49%(+0.274)#2,229 |
| 40. | Gaithersburg | 0.75% | 0.32%(+0.437)#40 | 0.49%(+0.266)#2,245 |
| 41. | South Kensington | 0.75% | 0.32%(+0.436)#41 | 0.49%(+0.265)#2,247 |
| 42. | California | 0.73% | 0.32%(+0.417)#42 | 0.49%(+0.246)#2,295 |
| 43. | Odenton | 0.71% | 0.32%(+0.397)#43 | 0.49%(+0.225)#2,334 |
| 44. | White Oak | 0.71% | 0.32%(+0.394)#44 | 0.49%(+0.223)#2,349 |
| 45. | Rockville | 0.69% | 0.32%(+0.376)#45 | 0.49%(+0.205)#2,397 |
| 46. | Ilchester | 0.68% | 0.32%(+0.365)#46 | 0.49%(+0.194)#2,424 |
| 47. | Kensington | 0.67% | 0.32%(+0.353)#47 | 0.49%(+0.182)#2,446 |
| 48. | Damascus | 0.66% | 0.32%(+0.343)#48 | 0.49%(+0.171)#2,478 |
| 49. | Flower Hill | 0.66% | 0.32%(+0.340)#49 | 0.49%(+0.169)#2,488 |
| 50. | Poolesville | 0.63% | 0.32%(+0.317)#50 | 0.49%(+0.146)#2,568 |
| 51. | Owings Mills | 0.63% | 0.32%(+0.309)#51 | 0.49%(+0.138)#2,604 |
| 52. | Greenbelt | 0.61% | 0.32%(+0.296)#52 | 0.49%(+0.125)#2,645 |
| 53. | Four Corners | 0.61% | 0.32%(+0.289)#53 | 0.49%(+0.118)#2,658 |
| 54. | Ellicott City | 0.60% | 0.32%(+0.286)#54 | 0.49%(+0.114)#2,668 |
| 55. | Mayo | 0.59% | 0.32%(+0.277)#55 | 0.49%(+0.106)#2,695 |
| 56. | Cabin John | 0.59% | 0.32%(+0.276)#56 | 0.49%(+0.104)#2,698 |
| 57. | Baden | 0.58% | 0.32%(+0.262)#57 | 0.49%(+0.091)#2,741 |
| 58. | North Kensington | 0.57% | 0.32%(+0.250)#58 | 0.49%(+0.079)#2,798 |
| 59. | Hillandale | 0.56% | 0.32%(+0.243)#59 | 0.49%(+0.072)#2,837 |
| 60. | Elkridge | 0.56% | 0.32%(+0.242)#60 | 0.49%(+0.071)#2,842 |
| 61. | Hillcrest Heights | 0.55% | 0.32%(+0.230)#61 | 0.49%(+0.059)#2,890 |
| 62. | Annapolis | 0.54% | 0.32%(+0.226)#62 | 0.49%(+0.055)#2,906 |
| 63. | Catonsville | 0.53% | 0.32%(+0.214)#63 | 0.49%(+0.043)#2,950 |
| 64. | Chevy Chase Village | 0.53% | 0.32%(+0.214)#64 | 0.49%(+0.043)#2,954 |
| 65. | Springdale | 0.53% | 0.32%(+0.209)#65 | 0.49%(+0.038)#2,978 |
| 66. | Parkville | 0.51% | 0.32%(+0.198)#66 | 0.49%(+0.027)#3,017 |
| 67. | Severna Park | 0.51% | 0.32%(+0.195)#67 | 0.49%(+0.024)#3,029 |
| 68. | Ocean Pines | 0.51% | 0.32%(+0.195)#68 | 0.49%(+0.024)#3,030 |
| 69. | Friendly | 0.51% | 0.32%(+0.191)#69 | 0.49%(+0.020)#3,044 |
| 70. | Severn | 0.50% | 0.32%(+0.185)#70 | 0.49%(+0.014)#3,073 |
| 71. | Potomac | 0.50% | 0.32%(+0.180)#71 | 0.49%(+0.009)#3,093 |
| 72. | Chestertown | 0.49% | 0.32%(+0.173)#72 | 0.49%(+0.001)#3,141 |
| 73. | Aspen Hill | 0.47% | 0.32%(+0.157)#73 | 0.49%(-0.014)#3,214 |
| 74. | Woodlawn Cdp Baltimore County | 0.47% | 0.32%(+0.150)#74 | 0.49%(-0.021)#3,241 |
| 75. | Smithsburg | 0.46% | 0.32%(+0.146)#75 | 0.49%(-0.025)#3,266 |
| 76. | Bel Air North | 0.46% | 0.32%(+0.144)#76 | 0.49%(-0.028)#3,282 |
| 77. | North Potomac | 0.45% | 0.32%(+0.137)#77 | 0.49%(-0.034)#3,310 |
| 78. | Brunswick | 0.45% | 0.32%(+0.133)#78 | 0.49%(-0.038)#3,339 |
| 79. | Cottage City | 0.45% | 0.32%(+0.132)#79 | 0.49%(-0.039)#3,343 |
| 80. | Frederick | 0.44% | 0.32%(+0.120)#80 | 0.49%(-0.051)#3,397 |
| 81. | Clinton | 0.43% | 0.32%(+0.111)#81 | 0.49%(-0.060)#3,449 |
| 82. | North East | 0.42% | 0.32%(+0.102)#82 | 0.49%(-0.069)#3,485 |
| 83. | Largo | 0.41% | 0.32%(+0.092)#83 | 0.49%(-0.079)#3,547 |
| 84. | Bel Air South | 0.41% | 0.32%(+0.092)#84 | 0.49%(-0.080)#3,550 |
| 85. | Redland | 0.40% | 0.32%(+0.082)#85 | 0.49%(-0.090)#3,604 |
| 86. | Berwyn Heights | 0.39% | 0.32%(+0.076)#86 | 0.49%(-0.095)#3,627 |
| 87. | Somerset | 0.39% | 0.32%(+0.073)#87 | 0.49%(-0.098)#3,649 |
| 88. | Andrews Afb | 0.39% | 0.32%(+0.071)#88 | 0.49%(-0.100)#3,655 |
| 89. | Westminster | 0.38% | 0.32%(+0.067)#89 | 0.49%(-0.104)#3,683 |
| 90. | Travilah | 0.38% | 0.32%(+0.062)#90 | 0.49%(-0.109)#3,712 |
| 91. | Milford Mill | 0.38% | 0.32%(+0.061)#91 | 0.49%(-0.110)#3,716 |
| 92. | Lanham | 0.38% | 0.32%(+0.061)#92 | 0.49%(-0.110)#3,718 |
| 93. | Brooklyn Park | 0.37% | 0.32%(+0.055)#93 | 0.49%(-0.116)#3,750 |
| 94. | Coral Hills | 0.36% | 0.32%(+0.045)#94 | 0.49%(-0.126)#3,812 |
| 95. | Chester | 0.36% | 0.32%(+0.043)#95 | 0.49%(-0.128)#3,822 |
| 96. | Eldersburg | 0.36% | 0.32%(+0.039)#96 | 0.49%(-0.132)#3,847 |
| 97. | Glenn Dale | 0.34% | 0.32%(+0.025)#97 | 0.49%(-0.146)#3,960 |
| 98. | Deale | 0.34% | 0.32%(+0.024)#98 | 0.49%(-0.148)#3,964 |
| 99. | Hagerstown | 0.33% | 0.32%(+0.013)#99 | 0.49%(-0.158)#4,035 |
| 100. | Fort Meade | 0.33% | 0.32%(+0.013)#100 | 0.49%(-0.158)#4,036 |
Common Questions
What are the Top 10 Cities with the Highest Percentage of Bhutanese Population in Maryland?
Top 10 Cities with the Highest Percentage of Bhutanese Population in Maryland are:
#1
6.57%
#2
5.86%
#3
5.36%
#4
2.14%
#5
2.10%
#6
1.63%
#7
1.62%
#8
1.57%
#9
1.57%
#10
1.51%
What city has the Highest Percentage of Bhutanese Population in Maryland?
Queen Anne has the Highest Percentage of Bhutanese Population in Maryland with 6.57%.
What is the Percentage of Bhutanese Population in the State of Maryland?
Percentage of Bhutanese Population in Maryland is 0.32%.
What is the Percentage of Bhutanese Population in the United States?
Percentage of Bhutanese Population in the United States is 0.49%.