Cities with the Highest Percentage of Population Employed in Management in Maryland
RELATED REPORTS & OPTIONS
Management
Maryland
Compare Cities
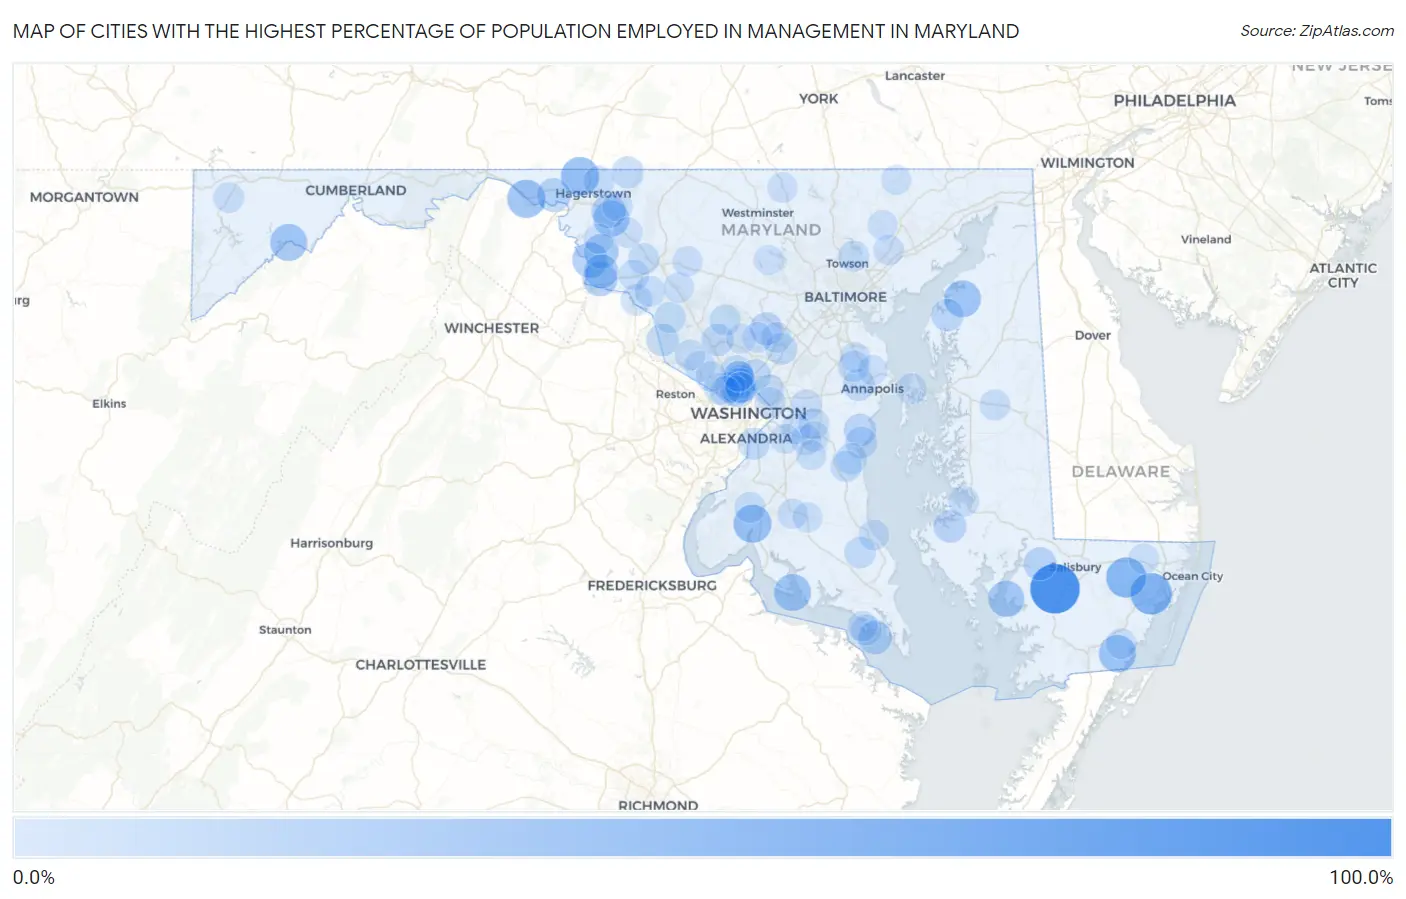
Map of Cities with the Highest Percentage of Population Employed in Management in Maryland
0.0%
100.0%
Cities with the Highest Percentage of Population Employed in Management in Maryland
| City | % Employed | vs State | vs National | |
| 1. | Allen | 100.0% | 12.2%(+87.8)#1 | 11.0%(+89.0)#11 |
| 2. | Newark | 64.8% | 12.2%(+52.5)#2 | 11.0%(+53.8)#124 |
| 3. | Powellville | 59.5% | 12.2%(+47.2)#3 | 11.0%(+48.4)#155 |
| 4. | Cearfoss | 51.2% | 12.2%(+38.9)#4 | 11.0%(+40.1)#223 |
| 5. | Big Pool | 50.0% | 12.2%(+37.8)#5 | 11.0%(+39.0)#245 |
| 6. | Port Tobacco Village | 50.0% | 12.2%(+37.8)#6 | 11.0%(+39.0)#262 |
| 7. | Stockton | 47.4% | 12.2%(+35.1)#7 | 11.0%(+36.3)#291 |
| 8. | Lisbon | 45.7% | 12.2%(+33.5)#8 | 11.0%(+34.7)#317 |
| 9. | Rock Point | 45.5% | 12.2%(+33.2)#9 | 11.0%(+34.4)#322 |
| 10. | Luke | 45.2% | 12.2%(+33.0)#10 | 11.0%(+34.2)#325 |
| 11. | Butlertown | 44.7% | 12.2%(+32.5)#11 | 11.0%(+33.7)#335 |
| 12. | San Mar | 42.1% | 12.2%(+29.9)#12 | 11.0%(+31.1)#385 |
| 13. | Nanticoke Acres | 42.1% | 12.2%(+29.8)#13 | 11.0%(+31.0)#388 |
| 14. | Antietam | 38.9% | 12.2%(+26.7)#14 | 11.0%(+27.9)#469 |
| 15. | Garretts Mill | 37.1% | 12.2%(+24.9)#15 | 11.0%(+26.1)#514 |
| 16. | Chevy Chase Section Five | 36.4% | 12.2%(+24.1)#16 | 11.0%(+25.3)#542 |
| 17. | Mount Briar | 36.0% | 12.2%(+23.8)#17 | 11.0%(+25.0)#564 |
| 18. | Yarrowsburg | 34.8% | 12.2%(+22.5)#18 | 11.0%(+23.8)#617 |
| 19. | Still Pond | 34.5% | 12.2%(+22.3)#19 | 11.0%(+23.5)#633 |
| 20. | Beaver Creek | 34.0% | 12.2%(+21.7)#20 | 11.0%(+23.0)#650 |
| 21. | St George Island | 33.0% | 12.2%(+20.8)#21 | 11.0%(+22.0)#713 |
| 22. | Charlton | 32.7% | 12.2%(+20.5)#22 | 11.0%(+21.7)#734 |
| 23. | Quantico | 29.1% | 12.2%(+16.9)#23 | 11.0%(+18.1)#980 |
| 24. | Highland | 27.8% | 12.2%(+15.6)#24 | 11.0%(+16.8)#1,111 |
| 25. | Church Creek | 27.7% | 12.2%(+15.4)#25 | 11.0%(+16.6)#1,124 |
| 26. | Fairlee | 27.3% | 12.2%(+15.0)#26 | 11.0%(+16.3)#1,155 |
| 27. | Poolesville | 27.0% | 12.2%(+14.8)#27 | 11.0%(+16.0)#1,197 |
| 28. | Galesville | 26.8% | 12.2%(+14.6)#28 | 11.0%(+15.8)#1,228 |
| 29. | Washington Grove | 26.2% | 12.2%(+14.0)#29 | 11.0%(+15.2)#1,315 |
| 30. | North Chevy Chase | 26.0% | 12.2%(+13.8)#30 | 11.0%(+15.0)#1,342 |
| 31. | Chevy Chase Village | 25.2% | 12.2%(+13.0)#31 | 11.0%(+14.2)#1,469 |
| 32. | Garrett Park | 24.7% | 12.2%(+12.5)#32 | 11.0%(+13.7)#1,571 |
| 33. | Ringgold | 24.4% | 12.2%(+12.2)#33 | 11.0%(+13.4)#1,625 |
| 34. | Deale | 24.4% | 12.2%(+12.1)#34 | 11.0%(+13.3)#1,630 |
| 35. | Four Corners | 24.3% | 12.2%(+12.1)#35 | 11.0%(+13.3)#1,639 |
| 36. | West Laurel | 24.3% | 12.2%(+12.1)#36 | 11.0%(+13.3)#1,641 |
| 37. | Parole | 24.2% | 12.2%(+11.9)#37 | 11.0%(+13.2)#1,670 |
| 38. | National Harbor | 24.1% | 12.2%(+11.8)#38 | 11.0%(+13.0)#1,695 |
| 39. | Cabin John | 23.8% | 12.2%(+11.6)#39 | 11.0%(+12.8)#1,755 |
| 40. | Broomes Island | 23.1% | 12.2%(+10.9)#40 | 11.0%(+12.1)#1,883 |
| 41. | Herald Harbor | 22.9% | 12.2%(+10.7)#41 | 11.0%(+11.9)#1,933 |
| 42. | Chevy Chase | 22.3% | 12.2%(+10.1)#42 | 11.0%(+11.3)#2,056 |
| 43. | Friendship | 22.1% | 12.2%(+9.90)#43 | 11.0%(+11.1)#2,103 |
| 44. | Point Of Rocks | 22.0% | 12.2%(+9.75)#44 | 11.0%(+11.0)#2,130 |
| 45. | Braddock Heights | 22.0% | 12.2%(+9.75)#45 | 11.0%(+11.0)#2,132 |
| 46. | Martin S Additions | 21.9% | 12.2%(+9.68)#46 | 11.0%(+10.9)#2,157 |
| 47. | Owings | 21.9% | 12.2%(+9.67)#47 | 11.0%(+10.9)#2,158 |
| 48. | Laytonsville | 21.8% | 12.2%(+9.53)#48 | 11.0%(+10.7)#2,198 |
| 49. | Chevy Chase View | 21.7% | 12.2%(+9.48)#49 | 11.0%(+10.7)#2,213 |
| 50. | Barnesville | 21.6% | 12.2%(+9.39)#50 | 11.0%(+10.6)#2,240 |
| 51. | University Park | 21.6% | 12.2%(+9.38)#51 | 11.0%(+10.6)#2,242 |
| 52. | Paramount Long Meadow | 20.9% | 12.2%(+8.70)#52 | 11.0%(+9.92)#2,438 |
| 53. | Pomfret | 20.9% | 12.2%(+8.62)#53 | 11.0%(+9.84)#2,463 |
| 54. | Travilah | 20.8% | 12.2%(+8.59)#54 | 11.0%(+9.80)#2,478 |
| 55. | Hampton | 20.8% | 12.2%(+8.55)#55 | 11.0%(+9.77)#2,491 |
| 56. | Woodmore | 20.4% | 12.2%(+8.19)#56 | 11.0%(+9.40)#2,603 |
| 57. | Colmar Manor | 20.3% | 12.2%(+8.10)#57 | 11.0%(+9.32)#2,624 |
| 58. | Piney Point | 20.2% | 12.2%(+8.01)#58 | 11.0%(+9.22)#2,663 |
| 59. | Wildewood | 20.2% | 12.2%(+7.94)#59 | 11.0%(+9.16)#2,683 |
| 60. | Brock Hall | 20.1% | 12.2%(+7.89)#60 | 11.0%(+9.11)#2,693 |
| 61. | Accident | 19.9% | 12.2%(+7.67)#61 | 11.0%(+8.88)#2,802 |
| 62. | Jefferson | 19.9% | 12.2%(+7.63)#62 | 11.0%(+8.84)#2,812 |
| 63. | Stevensville | 19.7% | 12.2%(+7.50)#63 | 11.0%(+8.71)#2,855 |
| 64. | Calvert Beach | 19.7% | 12.2%(+7.47)#64 | 11.0%(+8.69)#2,868 |
| 65. | Algonquin | 19.6% | 12.2%(+7.38)#65 | 11.0%(+8.60)#2,895 |
| 66. | Queen Anne | 19.6% | 12.2%(+7.37)#66 | 11.0%(+8.59)#2,896 |
| 67. | Darnestown | 19.4% | 12.2%(+7.21)#67 | 11.0%(+8.43)#2,958 |
| 68. | Adamstown | 19.4% | 12.2%(+7.20)#68 | 11.0%(+8.41)#2,967 |
| 69. | Girdletree | 19.4% | 12.2%(+7.17)#69 | 11.0%(+8.38)#2,980 |
| 70. | Urbana | 19.3% | 12.2%(+7.04)#70 | 11.0%(+8.26)#3,034 |
| 71. | Bethesda | 19.1% | 12.2%(+6.89)#71 | 11.0%(+8.10)#3,096 |
| 72. | Fulton | 18.9% | 12.2%(+6.64)#72 | 11.0%(+7.86)#3,186 |
| 73. | Kingsville | 18.9% | 12.2%(+6.62)#73 | 11.0%(+7.83)#3,195 |
| 74. | Somerset | 18.8% | 12.2%(+6.58)#74 | 11.0%(+7.79)#3,212 |
| 75. | South Kensington | 18.8% | 12.2%(+6.54)#75 | 11.0%(+7.76)#3,226 |
| 76. | Queensland | 18.8% | 12.2%(+6.54)#76 | 11.0%(+7.75)#3,227 |
| 77. | Bryantown | 18.7% | 12.2%(+6.43)#77 | 11.0%(+7.64)#3,279 |
| 78. | Westphalia | 18.6% | 12.2%(+6.41)#78 | 11.0%(+7.63)#3,286 |
| 79. | Mount Aetna | 18.6% | 12.2%(+6.35)#79 | 11.0%(+7.57)#3,314 |
| 80. | Severna Park | 18.5% | 12.2%(+6.22)#80 | 11.0%(+7.44)#3,370 |
| 81. | Linganore | 18.4% | 12.2%(+6.20)#81 | 11.0%(+7.42)#3,384 |
| 82. | Manchester | 18.4% | 12.2%(+6.19)#82 | 11.0%(+7.41)#3,388 |
| 83. | Tall Timbers | 18.4% | 12.2%(+6.19)#83 | 11.0%(+7.40)#3,392 |
| 84. | Potomac | 18.3% | 12.2%(+6.10)#84 | 11.0%(+7.32)#3,444 |
| 85. | Chevy Chase Section Three | 18.2% | 12.2%(+6.01)#85 | 11.0%(+7.22)#3,499 |
| 86. | Ashton Sandy Spring | 18.2% | 12.2%(+6.00)#86 | 11.0%(+7.22)#3,502 |
| 87. | Keedysville | 18.2% | 12.2%(+5.96)#87 | 11.0%(+7.18)#3,516 |
| 88. | Whaleyville | 18.2% | 12.2%(+5.95)#88 | 11.0%(+7.16)#3,541 |
| 89. | Upper Marlboro | 18.1% | 12.2%(+5.91)#89 | 11.0%(+7.12)#3,562 |
| 90. | Myersville | 18.1% | 12.2%(+5.84)#90 | 11.0%(+7.06)#3,585 |
| 91. | Croom | 18.0% | 12.2%(+5.73)#91 | 11.0%(+6.94)#3,634 |
| 92. | Eldersburg | 17.6% | 12.2%(+5.41)#92 | 11.0%(+6.63)#3,825 |
| 93. | Glen Echo | 17.5% | 12.2%(+5.28)#93 | 11.0%(+6.50)#3,888 |
| 94. | Fallston | 17.5% | 12.2%(+5.24)#94 | 11.0%(+6.46)#3,907 |
| 95. | Pylesville | 17.5% | 12.2%(+5.24)#95 | 11.0%(+6.46)#3,908 |
| 96. | Olney | 17.4% | 12.2%(+5.17)#96 | 11.0%(+6.39)#3,945 |
| 97. | Green Valley | 17.4% | 12.2%(+5.15)#97 | 11.0%(+6.36)#3,966 |
| 98. | Arnold | 17.4% | 12.2%(+5.12)#98 | 11.0%(+6.34)#3,978 |
| 99. | Hughesville | 17.3% | 12.2%(+5.08)#99 | 11.0%(+6.29)#4,004 |
| 100. | Andrews Afb | 17.2% | 12.2%(+5.01)#100 | 11.0%(+6.23)#4,043 |
Common Questions
What are the Top 10 Cities with the Highest Percentage of Population Employed in Management in Maryland?
Top 10 Cities with the Highest Percentage of Population Employed in Management in Maryland are:
#1
100.0%
#2
64.8%
#3
59.5%
#4
51.2%
#5
50.0%
#6
50.0%
#7
47.4%
#8
45.5%
#9
45.2%
#10
44.7%
What city has the Highest Percentage of Population Employed in Management in Maryland?
Allen has the Highest Percentage of Population Employed in Management in Maryland with 100.0%.
What is the Percentage of Population Employed in Management in the State of Maryland?
Percentage of Population Employed in Management in Maryland is 12.2%.
What is the Percentage of Population Employed in Management in the United States?
Percentage of Population Employed in Management in the United States is 11.0%.